


INTRODUCTION
The prevalence of obesity has increased substantially worldwide and is labeled as a global epidemic, moreover, the prevalence of obesity or severe obesity has increased globally during the coronavirus disease-19 pandemic [1,2]. Nearly one-third of the world’s population is classified as overweight or obese [2]. Diabetes and hypertension are representative chronic diseases that are highly related to obesity, have a significant negative impact on cardiovascular health and affect the occurrence of kidney disease and cancer [3,4].
Patel et al. [5] showed that body mass index (BMI) and waist circumference (WC) are both reasonable predictors of prevalent diabetes and hypertension which are major risk factors for kidney disease, stroke, cancer, and cardio vascular disease (CVD), and that both obesity measures can identify those with increased cardiovascular risk. BMI is a measure of overall fat accumulation in the body (general obesity) and WC is a measure of fat accumulation in the abdomen (abdominal obesity). The most widely used definition of obesity is general obesity, which is based on the BMI, which is also used to evaluate nutritional status [6].
However, as BMI does not differentiate between fat mass and muscle mass, a high BMI does not necessarily indicate a large amount of fat mass, and a low BMI does not necessarily indicate a low amount of fat mass [7]. When muscle loss occurs due to aging or disease, BMI is likely to be low. In particular, Asians tend to have higher levels of visceral fat compared to other ethnicities, even at the same BMI. A substantial number of individuals with type 2 diabetes, particularly those of Asian or African descent, are not obese according to the BMI criterion [8]. Since abdominal obesity is highly correlated with visceral fat, WC has a greater impact on metabolic diseases including diabetes and hypertension than BMI [9,10]. Therefore, solely relying on BMI to assess obesity may hinder future interventions aimed at obesity-related diseases as well as obesity prevention and control [2].
General obesity with BMI ‚Č•30 kg‚ĀĄm2 and abdominal obesity accounted for approximately 35.48% and 53.13%, of cases of obesity, respectively, with an increasing trend in adults in the United States (US) from 2001 to 2018 [11]. In Korean adults, the prevalence of general (based on Korean general obesity standard, BMI ‚Č•25 kg‚ĀĄm2) and abdominal obesity was 35.7% and 23.8% in 2018, respectively, with increasing trends for both from 2009 to 2018 [12].
A number of studies have analyzed the effects of obese groups on diabetes and hypertension using either the general obesity measurement method or the central obesity measurement method by comparing non-obese and obese groups. Recently, Yamada et al. [13] showed that a higher BMI (compared to normal BMI) was an independent risk factor for diabetes, hypertension, and dyslipidemia in retrospective cohort study of 10,852 Japanese individuals aged 65 years, with the effects on diabetes and hypertension being larger than that on dyslipidemia. Ren et al. [14] showed in a crosssectional study that compared with individuals with a normal BMI but no central obesity, central obesity was associated with an increased risk of hypertension in Chinese adults with normal BMI.
Moreover, there are controversial results for the risk of obesity related diseases between general and abdominal obesity. It has been shown that abdominal obesity without general obesity is associated with an elevated risk of CVD while general obesity without abdominal obesity is not [15]. Hypertension has the strongest association with general obesity in women, while prediabetes has the strongest association with abdominal obesity in men [16].
In this study, obese adults with at least one of abdominal obesity or general obesity were classified into abdominal obesity-only group, general obesity-only group, and abdominal and general obesity group, and the effect of obesity type on diabetes or hypertension was investigated more effectively by comparing these obesity types. By identifying the types of obesity that are particularly susceptible to type 2 diabetes and hypertension, respectively, we hope that our findings will help inform effective obesity management.
METHODS
1. Data collection and study subjects
The Korean National Health and Nutrition Examination Survey (KNHANES) is a nationwide population-based survey conducted to assess the health and nutritional status of the Korean population. This study used data from the 2016-2020 KNHANES, which included 31,181 adults aged 20 years or older. After excluding 9,777 participants with missing data on the variables of interest from the initial data set, a sample of individuals belonging to the obese group was generated from the remaining 21,404 data points.
Obesity was defined as general obesity when BMI ‚Č•25 kg‚ĀĄm2, and as abdominal obesity when WC was ‚Č•90 cm in males and ‚Č•85 in females. These thresholds were determined based on the obesity classification standards set by the Korean Society for the Study of Obesity taking into account the modified criteria for East and South Asians from the international thresholds defined by the World Health Organization [17].
Therefore, after excluding 12,490 participants (58.35%) with normal BMI and WC standards, a final study sample including 8,914 participants with general or abdominal obesity were selected from the total of 21,404 subjects.
The KNHANES consists of a health survey, health examination survey, and nutrition survey. This study used the health survey and health examination survey data, and excluded the nutrition survey. Data were collected through self-reports or face-to-face interviews, and most health examinations were conducted at mobile examination centers by trained specialists, including physicians. The survey used a complex stratified sampling design based on geographical area, sex, and age of the survey subjects, with corresponding weights assigned to the survey data. Additionally, when integrating the data for each of the 5 years from 2016 to 2020, a weight of 1/5 was assigned to each year. The KNHANES data are publicly available, and detailed explanations can be found on the KNHANES website (http://knhanes.cdc.go.kr).
2. Variables
Obesity type, which was the main explanatory variable, was classified as abdominal obesity without general obesity that is abdominal obesity-only waist circumference (OB_WC), general obesity without abdominal obesity that is general obesity-only body mass index (OB_BMI), and abdominal and general obesity (OB_both).
Diabetes was defined as fasting blood glucose ‚Č•126 mg/dL, or taking antidiabetic medications, or as diagnosed by a doctor. Hypertension was defined as systolic blood pressure ‚Č•140 mmHg, or diastolic blood pressure ‚Č•90 mmHg, or taking antihypertensive medications, or as diagnosed by a doctor.
Sociodemographic variables including sex, age, household income, education level, economic activity, and marital status were controlled for. Age was categorized into 20-39 years, 40-59 years, and 60 years or older, and household income was evaluated as the average monthly income (unit: 10,000 won). The level of education was divided into 1 (elementary)-8 (graduate school), and economic activity was classified as 'yes' if they were engaged in vocational activities and 'no' if they were not. Marital status was classified into three levels according to marital status and whether they lived with their spouse (living with a spouse, including common-law marriage; not living with a spouse due to divorce, bereavement, or separation; and never married).
Health behavior variables including stress, smoking, and drinking were also controlled for. Stress was classified on a 4-point scale from almost no stress to very severe stress. The average frequency of drinking per week was calculated based on the participants’ responses (0: no drinking experience or more than 1 year; 0.25: less than once a month or equal to once a month; 0.75: 2-4 times a month; 2.5: 1 week 2-3 times; 5: 4 or more times a week) [18]. Smoking status was classified as never (no smoking experience), former (past smoking), sometimes (occasional smoking), or daily (daily smoking).
Disease-related variables, including cancer (stomach cancer, liver cancer, colon cancer, breast cancer, cervical cancer, lung cancer, thyroid cancer, etc.), stroke, heart disease (myocardial infarction or angina), renal disease, hypercholesterolemia, and hypertriglyceridemia, were controlled for. Cancer, stroke, and heart disease were defined as having been diagnosed by a physician. Hypercholesterolemia was defined as total cholesterol ‚Č•240 mg/dL or taking cholesterol-lowering drugs, and hypertriglyceridemia was defined as triglyceride ‚Č•200 mg/dL. Renal disease was defined as being diagnosed by a doctor or positive proteinuria or estimated glomerular filtration rate <60 mL/min/1.73 m2 (using chronic kidney disease epidemiology collaboration formula) [19].
3. Statistical analysis
This study integrated 5 years of KNHANES data using integrated weights. Descriptive statistics, chi-square tests, and analyses of variance of complex survey data were performed as part of the primary analysis of the sample data. All analyses were performed using the statistical package R version 4.0.5 (R Foundation for Statistical Computing, Vienna, Austria) and reflected the complex sampling design of the data (stratified two-level cluster design). The effects of obesity type on diabetes and hypertension were analyzed using a logistic regression model of complex survey data that controlled sociodemographic, health behaviors, and disease-related covariates.
RESULTS
1. Sample characteristics
The proportions of obesity types were 12.87% for OB_WC, 22.35% for OB_BMI, and 64.78% for OB_both(Table 1). The proportion of women was 51.80% in the OB_WC group, 39.48% in the OB_BMI group, and 40.59% in the OB_both. In the OB_WC group, 9.20% of the patients were 20-39 years old, 33.28% were 40-59 years old, and 57.52% were 60 years or older. In the OB_BMI group, 37.68% were 20-39 years old, 45.20% were 40-59 years old, and 17.12% were 60 years or older. In the OB_both group, 28.79% were aged 20-39 years, 40.93% were aged 40-59 years, and 30.28% were aged 60 years or older.
In the OB_WC group, 74.18% lived with their spouse, 20.31% did not live with their spouse, and 5.51% had never been married. In the OB_BMI group, 66.40% lived with their spouse, 7.82% did not live with their spouse, and 2.58% had never been married. In the OB_both group, 69.25% lived with their spouse, 12.29% did not live with their spouse, and 18.47% had never been married. The average education was 4.90 (standard deviation [SD], 1.66) in the OB_WC group, 5.78 (SD, 1.38) in the OB_BMI group, and 5.42 (SD, 1.55) in the OB_both group. Five points indicated high school education level, and six points indicated 2-year/3-year university education level. Economic activity was 46.52% for the OB_WC group, 30.54% for the OB_BMI group, and 34.90% for the OB_both group. Household income was 380.81 (SD, 311.16) for the OB_WC group, 478.44 (SD, 302.55) for the OB_BMI group, and 445.63 (SD, 321.74) for the OB_both group.
Current smoking rates in the OB_WC group (17.28%) were lower than those in the OB_BMI (21.52%) and OB_both (22.41%) groups. There was no significant difference in the frequency of drinking among the different obesity types, which was approximately 1 week. The degree of perceived stress was 2.06 (SD, 0.70), 2.17 (SD, 0.71), and 2.21 (SD, 0.78) in the OB_WC, OB_BMI, and OB_both groups, respectively.
The incidences of cancer, stroke, and heart disease were 6.80%, 4.43%, and 5.13%, respectively, in the OB_WC group; 2.88%, 1.10%, and 2.02%, respectively, in the OB_BMI group; and 4.67%, 2.23%, and 2.94%, respectively, in the OB_both group. The rates of renal disease, hypercholesterolemia, and hypertriglyceridemia were 19.66%, 35.39%, and 19.11% in the OB_WC group; 15.15%, 21.67%, and 20.79% in the OB_BMI group; and 22.16%, 31.01%, and 25.63% in the OB_both groups, respectively.
The prevalence of diabetes was 20.78% in the OB_WC, 7.74% in the OB_BMI, and 18.39% in the OB_both group, while that of hypertension was 45.21% in the OB_WC, 27.72% in the OB_BMI, and 46.31% in the OB_both group.
2. Logistic regression analysis for diabetes and hypertension
The incidence of diabetes and hypertension was higher in women (diabetes: odds ratio [OR], 0.64; 95% confidence interval [CI], 0.52-0.81; hypertension: OR, 0.59; 95% CI, 0.50-0.70) and among older individuals (diabetes: OR, 2.53; 95% CI, 1.85-3.46 for 40-59 years old; OR, 2.97; 95% CI, 2.14-4.13 for ‚Č•60 years old; hypertension: OR, 2.53; 95% CI, 2.07-3.09 for 40-59 years old; OR, 5.82; 95% CI, 4.64-7.30 for ‚Č•60 years old). Further, the higher the level of education, the lower the incidence of diabetes (OR, 0.88; 95% CI, 0.84-0.93) and hypertension (OR, 0.87; 95% CI, 0.83-0.91). Household income, stress, and smoking status were not significantly associated with diabetes or hypertension.
Individuals who were single had a lower incidence of diabetes (OR, 0.68; 95% CI, 0.49-0.94) compared to married people who lived with their spouse. Meanwhile, married people who did not live with their spouse had a higher incidence of diabetes and hypertension compared to those who lived with their spouse (diabetes: OR, 1.29; 95% CI, 1.08-1.54; hypertension: OR, 1.40; 95% CI, 1.19-1.64). The incidence of diabetes (OR, 1.24; 95% CI, 1.05-1.46) was higher among individuals with an occupational activity, and there was no significant association between occupational status and hypertension. Drinking frequency was not significantly associated with diabetes, but higher drinking frequency increased the incidence of hypertension (OR, 1.16; 95% CI, 1.10-1.22).
Among disease factors, cancer was significantly associated with diabetes at significance level 0.1 (OR, 1.28; 95% CI, 0.96-1.72; P-value=0.091), but was not significantly associated with hypertension. Stroke (diabetes: OR, 2.06; 95% CI, 1.42-3.00; hypertension: OR, 2.46; 95% CI, 1.65-3.67), renal disease (diabetes: OR, 2.09; 95% CI, 1.79-2.43; hypertension: OR, 1.48; 95% CI, 1.29-1.70) and hypercholesterolemia (diabetes: OR, 1.68; 95% CI, 1.46-1.93; hypertension: OR, 2.04; 95% CI, 1.80-2.31) were all positively associated with diabetes and hypertension. Heart disease had a significant association at significant level 0.1 with diabetes (OR, 1.31; 95% CI, 0.96-1.79; P-value=0.094) and hypertension (OR, 1.59; 95% CI, 1.12-2.26). Hypertriglyceridemia had no significant association with hypertension, but a positive association with diabetes (OR, 1.37; 95% CI, 1.17-1.61). Regarding obesity type, which is a major factor of interest, the OB_BMI group had a lower incidence of diabetes compared to the OB_WC group (OR, 0.60; 95% CI, 0.47-0.77). Meanwhile, the OB_both group had a higher incidence of diabetes than the OB_WC group, but the difference was not statistically significant (OR, 1.14; 95% CI, 0.95-1.37). Regarding the occurrence of hypertension, there was no significant difference between the OB_WC and OB_BMI groups (OR, 1.03; 95% CI, 0.85-1.26), but the OB_both group had a higher incidence of hypertension compared to the OB_WC group (OR, 1.82; 95% CI, 1.54-2.15). The results are summarized in Table 2.
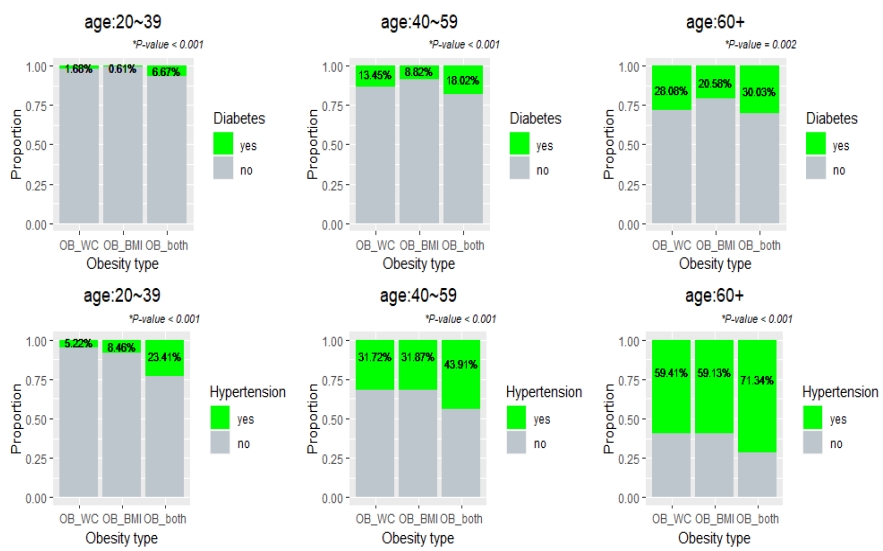
Diabetes and hypertension had the highest correlation with age; therefore, the incidence of diabetes and hypertension was investigated according to age. Results showed that the OB_BMI group had the lowest incidence of diabetes over all age groups, while the OB_both group had the highest incidence of hypertension over all age groups (Figure 1).
DISCUSSION
This study analyzed the effects of obesity type on diabetes and hypertension in adults aged ‚Č•20 years who were classified as obese according to BMI (general obesity criteria) or WC (abdominal obesity criteria) using data from the KNHANES (2016-2020). Obesity type was classified as abdominal obesity but not general obesity (abdominal obesity-only), general obesity but not abdominal obesity (general obesity-only), or both abdominal and general obesity (abdominal and general obesity).
Among the individuals classified as obese, the proportions of abdominal obesity-only, general obesity-only, and abdominal and general obesity were 12.87%, 22.35%, and 64.78%; respectively. These figures indicate that 77.65% of obese people have abdominal obesity and 87.13% have general obesity. Thus, the prevalence of general obesity rate is higher than that of abdominal obesity, but the difference is small. This trend is consistent with the Obesity Fact Sheet in Korea (2020) [12], which reported increasing rates of general and abdominal obesity since 2009, with a gradual narrowing of the gap between the two. Considering that the abdominal obesity rate in US adults is higher than that of general obesity [11], it is expected that the rate of increase in abdominal obesity will also accelerate in Korea.
According to the China Health and Nutrition Surveys conducted in 2009, it has been reported that abdominal obesity is more prevalent among females than males, and the prevalence of abdominal obesity in both sexes peaked in the middle and older age groups [20]. In this study, we observed a higher number of women and individuals aged 60 years or older with abdominal obesity-only. Conversely, there were more men and individuals under 60 years of age with either general obesity-only or both abdominal and general obesity. This suggests that as individuals age, the likelihood of developing abdominal obesity increases, even in those with a normal weight. From the adjusted ORs with significance tests, we found that the general obesity-only group had a lower incidence of diabetes than the abdominal obesity-only group (OR, 0.60; 95% CI, 0.47-0.77), and there was no significant difference between the abdominal and general obesity group and abdominal obesity-only group. So individuals with general obesity-only had a 0.60 times lower risk of developing diabetes than those with abdominal obesity-only, that is, individuals with abdominal obesity-only had a 1.67 times higher risk of developing diabetes compared to those with general obesity-only.
Obesity is a major risk factor for the development of diabetes, adipose tissue releases increased amounts of non-esterified fatty acids, glycerol, hormones, pro-inflammatory cytokines and other factors that are involved in the development of insulin resistance. When insulin resistance is accompanied by dysfunction of pancreatic islet beta-cells that secrete insulin, failure to control blood glucose levels occurs [21]. Metabolic syndrome which is known to be a primary predictor for type 2 diabetes is highly associated with a pro-inflammatory state, which results from abnormal changes in the normal balance of adipokines and these abnormalities are more likely to occur in obese people, particularly in those with abdominal obesity [22]. In addition, metabolic syndrome of excess fat is more closely related to the location of fat than body fat mass per se [23]. It has been shown that accumulation of fat in the gluteofemoral areas measured by computed tomography may even be metabolically protective [24] and abdominal (central) obesity is more strongly associated with diabetes or metabolic syndrome than general obesity [25,26].
Therefore, targeting the reduction of abdominal obesity would be more effective in preventing and treating diabetes, as well as in developing therapeutic interventions. This is especially true for those over the age of 60, as they have a higher likelihood of experiencing abdominal obesity, even if they have a normal weight, compared to those under 60.
For hypertension, the abdominal and general obesity group had a higher incidence of hypertension than the abdominal obesity-only group (OR, 1.82; 95% CI, 1.54-2.15), and there was no significant difference between the general obesity-only and abdominal obesity-only groups. That is, individuals with both abdominal and general obesity were found to have a 1.82 times higher incidence rate than those with either abdominal or general obesity alone. A number of studies have suggested that BMI and WC predict cardiovascular risk factors, including hypertension, equally well and suggest that WC is interchangeable with BMI as a risk predictor [5,27,28]. However, our findings suggest that the occurrence of hypertension is more evident in patients with both abdominal and general obesity.
Obesity raises blood pressure by increasing renal tubular sodium reabsorption, impairing pressure natriuresis, and causing volume expansion via activation of the sympathetic nervous system and renin-angiotensin-aldosterone system and by physical compression of the kidneys, especially when there is increased visceral adiposity [3]. So, the interaction between general obesity and central obesity affects hypertension. Rhee et al. [29] showed that the risk of developing hypertension increased significantly as WC increased in general obese individuals (BMI ‚Č•25), but not in non-obese individuals (BMI <25). Therefore, models evaluating the risk of hypertension must include both BMI and WC [30], and individuals with both abdominal and general obesity have a high risk of hypertension, regardless of age.
Regarding significant covariates other than obesity type, the incidence of diabetes and hypertension increased with age, with a higher incidence observed among men compared to females. Notably, the incidence of hypertension was 5.82 times higher among those aged 60 years or older compared to those aged 20-39, indicating a significantly higher risk of developing hypertension among older obese individuals compared to their younger counterparts.
Moreover, across all age groups, the difference in diabetes occurrence by obesity type was evident in younger age groups, but in the group over 60 years of age, which accounted for more than half of the abdominal obesity-only group, the difference between the abdominal obesity-only group and the abdominal and general obesity groups decreased. That is, the effect of obesity type on the incidence of diabetes differed by age group. However, the incidence of hypertension was highest in subjects with both abdominal and general obesity in all age groups and was similar between the abdominal obesity-only and general obesity-only groups (Figure 1). Therefore, although age was the most influential factor for hypertension in obese individuals, the association between hypertension and obesity type was generally less sensitive to age.
This study has several limitations. Firstly, due to the cross-sectional design, it was not possible to fully establish direct causal effects of obesity type on type 2 diabetes and hypertension. Future research could benefit from utilizing cohort studies or employing propensity score analyses to draw causal inferences. In addition, it is reasonable to consider the influence of eating habits or lifestyle (exercise, sleep, etc.) on chronic diseases, such as diabetes or hypertension; however, this study did not consider these factors. Thus, it will be necessary to expand and consider various covariates in future studies.
In conclusion, abdominal obesity plays a more substantial role in the development of diabetes compared to general obesity, while the risk of hypertension is greatest when both abdominal and general obesity coexist. Notably, more than half of individuals with only abdominal obesity are aged 60 years or older, and they may be classified as having a normal weight according to BMI standards. Consequently, these individuals may be excluded from obesity management, underscoring the need to monitor and address their diabetes risk. The risk of hypertension is much greater when both abdominal and general obesity are present than when only one is present; therefore, both BMI and WC should be used as obesity measures.
 PDF Links
 PubReader
 ePub Link
 Full text via DOI
 Download Citation
 Print
Print