Analysis of the Association between Health Literacy and Health Behaviors in Korean Adults
Article information

Abstract
Background
Health literacy is increasingly recognized as a key determinant of health behavior and preventive practice. This study aimed to evaluate the association between health literacy and major health behaviors in Korean adults using nationally representative data.
Methods
We conducted a cross-sectional analysis using the 2023–2024 Korea National Health and Nutrition Examination Survey. A total of 11,555 adults with complete health literacy responses were included. Health literacy was assessed using a 10-item questionnaire and categorized into quartiles (Q1: lowest; Q4: highest). Current smoking, high-risk drinking, insufficient physical activity, and non-participation in health screening were evaluated. Multivariable complex-sample logistic regression analyses were performed after adjusting for demographic and clinical covariates.
Results
Lower health literacy was associated with higher prevalence of current smoking, insufficient physical activity, and non-participation in health screening. In the fully adjusted model, participants in the lowest literacy group had significantly higher odds of current smoking (odds ratio [OR], 1.83; 95% confidence interval [CI], 1.44–2.32), insufficient physical activity (OR, 1.48; 95% CI, 1.26–1.74), and not receiving health screening (OR, 1.38; 95% CI, 1.16–1.65) compared with the highest group. High-risk drinking was not independently associated with health literacy.
Conclusions
Health literacy was independently associated with key health behaviors and preventive practice in Korean adults. Strategies to improve population health should consider not only access to information but also individuals’ capacity to understand and use health information.
INTRODUCTION
As the modern healthcare environment shifts toward patient-centered care, health literacy (HL), which refers to the capacity of individuals to obtain, process, and understand basic health information and services needed to make appropriate health decisions, has become more critical than ever [1,2]. HL transcends mere individual cognitive ability and is gaining attention as a core social determinant of health that influences health equity and the success of disease prevention [3,4]. Evidence consistently indicates that groups with low HL experience a higher prevalence of chronic diseases and inefficient use of healthcare services, which ultimately leads to poor health outcomes and increased healthcare expenditures [2,5].
Health behaviors such as smoking, alcohol consumption, physical activity, and regular participation in health screenings are direct factors determining an individual’s risk of disease and mortality [6,7]. These behaviors are closely linked to the ability to evaluate healthcare information and translate it into actual practice rather than being simple matters of personal choice [6,8]. In the current infodemic environment, which is characterized by an aging population, a surge in chronic diseases, and a vast influx of health information, the ability to select accurate information and apply it to self-care is essential [9,10]. Individuals with low HL encounter barriers in interpreting and utilizing complex health information, and this can lead to a decline in preventive health actions and a lack of self-care capacity [11,12].
While several studies have reported associations between HL and health behaviors, most have been limited to specific age groups or restricted samples [8,13]. In particular, systematic analyses evaluating various preventive health practices simultaneously using nationally representative data for Korean adults remain relatively scarce [14,15]. Reflecting the importance of these indicators, the Korea Disease Control and Prevention Agency newly introduced a multidimensional 10-item measurement tool in the 2023 Korea National Health and Nutrition Examination Survey (KNHANES) that covers the searching, understanding, evaluating, and utilizing of health information [16,17]. This provides a vital foundation for precisely measuring the HL of Koreans and elucidating its role as a determinant of health behavior [18].
Accordingly, this study aims to assess the level of HL among Korean adults using the 2023–2024 KNHANES data and evaluate its independent impact on major health behaviors, including smoking, high-risk drinking, and insufficient physical activity, as well as the utilization of preventive health services such as health screening [14,15]. The findings will confirm the independent value of HL beyond socioeconomic variables and educational attainment, providing practical evidence for establishing future public health strategies and patient-centered information delivery systems in clinical settings [19,20].
METHODS
Study population
This study was a cross-sectional analysis using data from the 2023–2024 KNHANES. KNHANES is a nationally representative survey conducted by the Korea Disease Control and Prevention Agency using a stratified, multistage probability sampling design to represent the Korean population [14].
Among 20,191 participants, individuals who had missing, inapplicable, or non-response answers to all 10 HL items were excluded. A total of 11,555 adults were included in the final analysis.
This study was conducted according to the guidelines for the use of KNHANES data. The 9th KNHANES (2023–2024) was approved by the Institutional Review Board of the Korea Disease Control and Prevention Agency (approval no. 2022-11-16-R-A, 2022-11-16-R-03) [16], and all participants provided written informed consent.
Measurement
Health survey and examination
The health interview and examination components of KNHANES were conducted by trained personnel following standardized procedures. Demographic characteristics including education level, household income, and marital status, as well as health behaviors such as smoking, alcohol consumption, and physical activity, were collected through face-to-face interviews and self-administered questionnaires. Beginning in 2023, some self-administered surveys were conducted online.
Height and weight were measured using standardized equipment, and body mass index (BMI) was calculated as weight in kilograms divided by height in meters squared.
Health literacy
HL was assessed using a 10-item questionnaire included in the KNHANES [17]. The items are designed to measure individuals’ self-reported ability to understand and use health information in daily life [18]. Specifically, the questionnaire includes the following domains:
1. Ability to judge necessary vaccinations.
2. Ability to understand the risks of mental health problems such as stress and depressive symptoms.
3. Ability to recognize health warning signs related to smoking, drinking, and lack of physical activity.
4. Ability to evaluate the impact of daily behaviors on health.
5. Ability to understand doctors’ explanations and instructions during medical visits.
6. Ability to determine appropriate actions in emergency situations.
7. Ability to understand healthcare professionals’ instructions regarding medication use.
8. Ability to understand patient education materials provided by hospitals.
9. Ability to evaluate the reliability of health information obtained from the internet and media.
10. Ability to use health information obtained from the internet and media for health-related decision-making.
Each item was rated on a 4-point Likert scale (“strongly disagree”=1, “disagree”=2, “agree”=3, “strongly agree”=4). The total score was calculated by summing the scores of the 10 items, with higher scores indicating higher HL. The internal consistency of the 10-item HL scale in this study population was high, with a Cronbach’s alpha of 0.912. In this study, participants were categorized into quartiles based on the total score distribution: Q1 (≤26), Q2 (27–29), Q3 (30–32), and Q4 (≥33).
Health behaviors and preventive practice
Current smoking was defined as daily or occasional smoking at the time of the survey.
High-risk drinking was defined as consuming alcohol at least twice per week and drinking seven or more drinks per occasion for men, or five or more drinks per occasion for females.
Insufficient physical activity was defined as not meeting the recommended level of at least 150 minutes of moderate-intensity physical activity per week, 75 minutes of vigorous-intensity activity per week, or an equivalent combination of moderate and vigorous activity [7,21].
Participation in preventive health screening was assessed based on whether participants had undergone health screening within the past 2 years. Individuals who had not received screening were classified as non-participants.
Covariates
Demographic covariates included age, sex, household income (quartiles), education level (elementary school or less, middle school, high school, college or higher), and marital status (currently living with a spouse). Health-related covariates included BMI and physician-diagnosed chronic diseases, including hypertension, dyslipidemia, and diabetes.
Statistical analysis
All analyses accounted for the complex sampling design of KNHANES by applying sampling weights. When combining the 2023 and 2024 datasets, survey weights were adjusted accordingly.
General characteristics were compared according to HL quartiles. Continuous variables were presented as mean±standard error using complex sample general linear models, and categorical variables were presented as weighted percentages using complex sample cross-tabulation analyses.
To evaluate the independent association between HL and each health behavior, complex sample logistic regression analyses were performed. Three models were constructed. Model 1 was unadjusted. Model 2 was adjusted for age and sex. Model 3 was fully adjusted for age, sex, BMI, household income, education level, marital status, hypertension, dyslipidemia, and diabetes. Additionally, to account for the potential confounding effect of psychological status, a sensitivity analysis (Model 4) was conducted by further adjusting for perceived stress level on top of the variables in Model 3; the detailed results of this analysis are provided in Supplementary Table 1. Results were presented as odds ratios (ORs) with 95% confidence intervals (CIs). A P-value less than 0.05 was considered statistically significant.
All statistical analyses were conducted using SPSS version 21.0 (SPSS Inc.).
RESULTS
From the 2023–2024 KNHANES, a total of 20,191 participants were identified. Among them, individuals who had missing, inapplicable, or non-response answers to all 10 HL items were excluded, and 11,555 participants were finally included in the analysis.
Participants were classified into four groups according to HL level (Q1–Q4), and their baseline characteristics are presented in Table 1 and Supplementary Fig. 1. The group with the highest HL level (Q4) was significantly younger than the group with the lowest HL level (Q1) (43.27±0.35 years vs. 57.08±0.61 years, P<0.001). In addition, higher HL level was clearly associated with higher household income (high income: Q4 39.9% vs. Q1 21.8%) and higher education level (college or higher: Q4 61.8% vs. Q1 23.4%) (P<0.001).
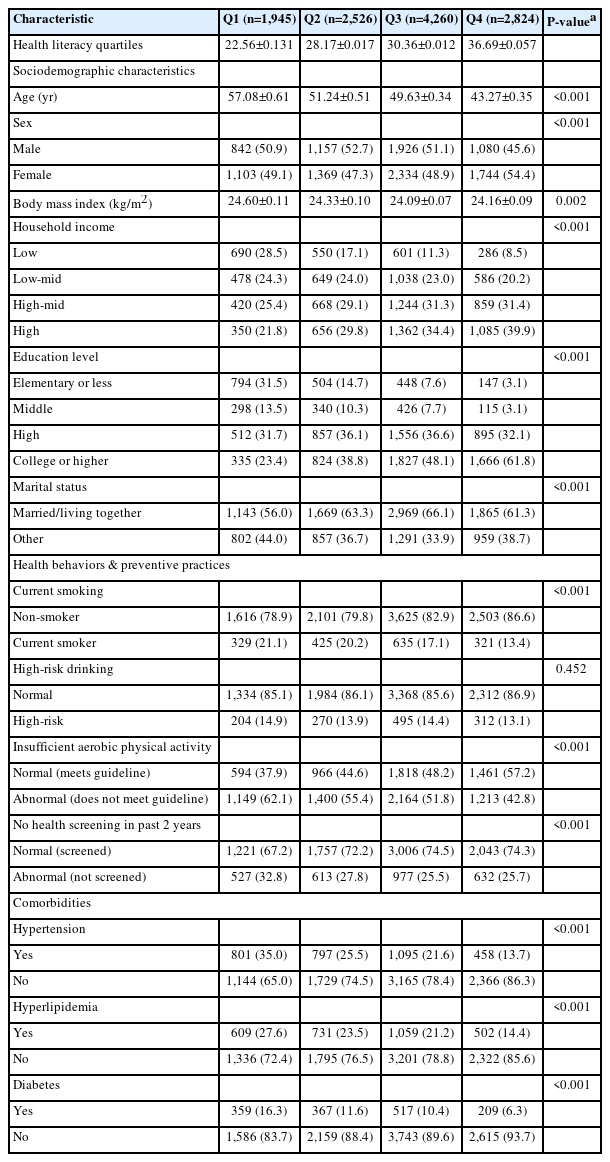
Baseline characteristics of the study population according to health literacy quartiles (Q1–Q4)
In the distribution analysis of health behaviors (Supplementary Fig. 1), lower HL level showed a stepwise increase in the prevalence of current smoking, insufficient physical activity, and non-participation in health screening.
Among health behaviors and preventive practices, statistically significant differences between HL groups were observed in all variables except high-risk drinking. The prevalence of current smoking (Q1 21.1% vs. Q4 13.4%, P<0.001), insufficient physical activity (Q1 62.1% vs. Q4 42.8%, P<0.001), and non-participation in health screening within the past 2 years (Q1 32.8% vs. Q4 25.7%, P<0.001) were all higher in groups with lower HL level. In contrast, high-risk drinking did not show a statistically significant difference between groups (Q1 14.9% vs. Q4 13.1%, P=0.452).
The results of complex sample logistic regression analyses according to HL level are presented in Table 2 and Supplementary Fig. 2. In the fully adjusted model (Model 3), compared with the highest HL group (Q4), the lowest HL group (Q1) had a significantly higher risk of current smoking (OR, 1.83 [95% CI, 1.44–2.32]; P<0.001).
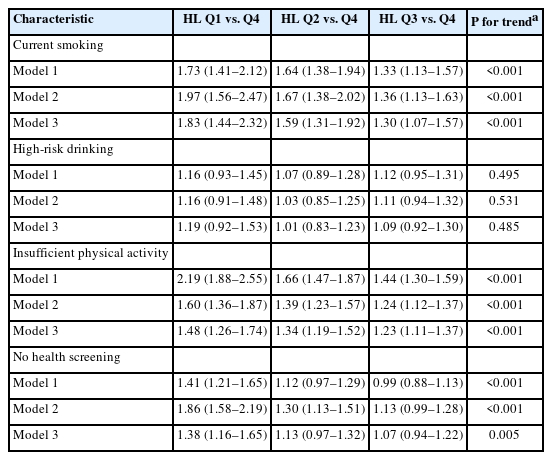
Adjusted associations between health literacy (HL) level and health risk behaviors
Insufficient physical activity also showed increased risk as HL level decreased (Q1 vs. Q4: OR, 1.48 [95% CI, 1.26–1.74]; Q2 vs. Q4: OR, 1.34 [95% CI, 1.19–1.52]; Q3 vs. Q4: OR, 1.23 [95% CI, 1.11–1.37]; all P<0.001), and a linear trend was observed.
The association with non-participation in health screening within the past 2 years was also maintained (Q1 vs. Q4: OR, 1.38 [95% CI, 1.16–1.65]; P=0.005), indicating that lower HL level was associated with lower screening participation.
However, high-risk drinking did not show a statistically significant association after adjustment (Q1 vs. Q4: OR, 1.19 [95% CI, 0.92–1.53]; P=0.485). Furthermore, in the sensitivity analysis (Model 4) that additionally adjusted for perceived stress level, the significant independent associations between lower HL and current smoking, insufficient physical activity, and non-participation in health screening remained robust, while high-risk drinking remained insignificant (Supplementary Table 1).
DISCUSSION
This study evaluated the association between the level of HL and major health behaviors as well as preventive health practices in Korean adults using the 2023–2024 KNHANES data. As a result of the study, lower HL was associated with higher rates of current smoking, insufficient physical activity, and non-participation in health screening; these associations were maintained even after adjusting for socioeconomic factors and chronic diseases. On the other hand, high-risk drinking did not show a statistically significant association after adjustment. This study suggests that HL is an important factor independently associated with actual health behaviors, beyond being a mere indicator of education level [15,20].
The association between HL and health behaviors has been repeatedly reported in existing studies [7,8]. Individuals with low HL are highly likely to experience difficulties in understanding and evaluating health information and translating it into action [14]. This can directly affect self-care behaviors such as smoking cessation, maintaining physical activity, and participating in preventive screenings. In particular, the linear trend observed in this study shows that HL is a continuous capacity rather than a discrete category, and health behaviors can vary stepwise according to that level [6].
The association with participation in preventive health screenings carries important meaning from a public health perspective. Health screening plays a key role in the early detection and management of diseases, but participation in screenings depends heavily on an individual’s information literacy and health decision-making ability [22,23]. The result showing lower screening participation rates in groups with low HL suggests that health inequalities may originate from differences in information accessibility and comprehension capacity [3].
In contrast, high-risk drinking, unlike other health behaviors, did not show an independent association with HL. This suggests that drinking habits are influenced more by social and cultural environments than by a person’s ability to understand health information. In South Korea, social drinking is very common, and people often drink to meet social expectations rather than by personal choice [24]. Also, previous studies show that a culture that easily accepts drinking often leads to alcohol problems among Korean adults [25]. In this kind of environment, social pressure can be stronger than personal health knowledge. This explains why HL did not strongly affect high-risk drinking in our study. Therefore, not all health behaviors work the same way, and public health strategies need to be customized for each specific behavior [26,27].
This study has strengths in that it performed an analysis considering the complex sample design using nationally representative data. Furthermore, it provides practical public health implications in that it evaluated HL through multidimensional items and analyzed its connection with various health behaviors.
However, several limitations exist. First, as it is a cross-sectional study design, causality cannot be established. While it is possible that HL affects health behaviors, the possibility that health behaviors affect information seeking and comprehension ability cannot be excluded. Therefore, future longitudinal studies utilizing cohort data, such as the National Health Insurance Service database, are essential to establish clear causality. Second, health behaviors were collected through a self-reporting method, so there is a possibility of reporting bias, including recall bias and social desirability bias. To ensure objectivity, future studies should validate these findings using objective measures, such as claims data for actual health screening records or wearable device data for physical activity. Third, the measurement of HL is based on self-evaluation, which may not fully reflect actual performance ability.
Nevertheless, the results of this study show the possibility that HL acts as an independent determinant in health behaviors and preventive practices. In future health promotion policies and intervention strategies, not only the quantity of information provision but also the understandability, accessibility, and personalized delivery methods of information need to be importantly considered [19]. Particularly, in order for healthcare professionals in clinical settings to identify patients’ HL levels in advance and provide tailored information, practical efforts such as strengthening customized communication skills training in the medical school curriculum and clinical training stages should be paralleled [20].
Supplementary material
Adjusted associations between health literacy (HL) level and health risk behaviors
Prevalence of health risk behaviors and preventive practices according to health literacy level.
Multivariable-adjusted odds ratios (ORs) for health risk behaviors according to health literacy quartiles (Model 3).
Notes
AUTHOR CONTRIBUTIONS
Dr. Gee Youn SONG had full access to all of the data in the study and takes responsibility for the integrity of the data and the accuracy of the data analysis. All authors reviewed this manuscript and agreed to individual contributions.
Conceptualization, Data curation, Formal analysis, Methodology, Investigation, Writing–original draft, Writing–review & editing: all authors.
CONFLICTS OF INTEREST
No existing or potential conflict of interest relevant to this article was reported.
FUNDING
None.
DATA AVAILABILITY
The data used in this study are publicly available from the Korea National Health and Nutrition Examination Survey (KNHANES).