Sex Differences in the Modifying Effect of Diabetes on the Exercise–Grip Strength Relationship: Korea National Health and Nutrition Examination Survey (2017–2019)
Article information

Abstract
Background
Handgrip strength (HGS) is an indicator of late-life health, associated with disability, cardiovascular and all-cause mortality. While exercise helps maintain HGS, diabetes may reduce its benefits. This study investigated the association between exercise and low HGS (LHGS) stratified by diabetes status and sex.
Methods
Data from 16,443 participants in the 2017–2019 Korea National Health and Nutrition Examination Survey were analyzed. HGS was measured using a digital dynamometer. Exercise type and frequency were assessed by questionnaire. Three-way and two-way interaction terms were analyzed for exercise, sex and diabetes.
Results
Aerobic exercise, resistance exercise, and diabetes were significantly associated with LHGS (P<0.05). A significant interaction between diabetes and aerobic exercise was observed in females (odds ratio [OR] of LHGS=1.704, 95% confidence interval=1.073–2.707). Among males, both exercise types were associated with lower odds of LHGS regardless of diabetes status, except for aerobic exercise in non-diabetic males. Among males, the ORs of LHGS for aerobic and resistance exercise were 0.479 (0.278–0.827) and 0.317 (0.165–0.611) with diabetes, 0.757 (0.554–1.035) and 0.536 (0.360–0.798) without diabetes. Among females, the ORs of LHGS for aerobic exercise and resistance exercise were 1.109 (0.716–1.719) and 0.529 (0.224–1.249) with diabetes, 0.676 (0.539–0.848) and 0.795 (0.564–1.121) without diabetes.
Conclusions
The modifying effect of diabetes on the relationship between exercise and grip strength was observed in females but not in males. Females with diabetes may require tailored exercise guideline to prevent LHGS.
INTRODUCTION
Handgrip strength (HGS) is a prognostic marker for future disability in older adults who are not yet disabled [1]. It has also been identified as a predictor of cardiovascular and all-cause mortality, including outcomes such as myocardial infarction and stroke [2,3]. HGS typically peaks between the ages of 29 and 39 and declines progressively with age [4]. A population-based study in Korea reported that approximately 32% of males and 33% of females aged 65 years or older exhibited low HGS (LHGS) [5]. Notably, significant sex-related differences have been observed, with males consistently demonstrating higher HGS than females [4].
Exercise is a well-established method for maintaining grip strength in older adults. A cross-sectional study found that elderly individuals who engaged in either aerobic or resistance exercise had significantly higher grip strength, with the greatest benefits observed when both exercise types were combined [6]. Aerobic activities, such as cycling, have also been shown to be as effective as resistance training in increasing skeletal muscle mass [7].
Moreover, the effects of exercise appear to differ by sex. A systematic review of prospective trials on exercise intervention reported that increase in upper and lower body strength and cardiorespiratory fitness was more significant in males while motor fitness, such as agility, balance, and speed, was more improved in females [8].
Type 2 diabetes, characterized by hyperglycemia, hyperinsulinemia and insulin resistance, is related with muscle atrophy and reduced strength in elderly population. According to a longitudinal study, elderly people with type 2 diabetes had accelerated reduction of leg muscle mass and strength compared with age matched healthy counterparts [9]. Cross-sectional study also showed that people with diabetes had significantly lower grip strength compared to those without the condition [10]. Moreover, when participating in the same resistance training program, individuals with diabetes tended to show smaller gains in muscle strength [11].
The pathophysiology of the detrimental effect of diabetes on muscle is complex. According to a research, peripheral neuropathy, a complication of diabetes, was associated with leg weakness [12]. An interventional study found that people with type 2 diabetes had impaired peak exercise performance compared to healthy age-matched controls [13]. Its follow up study found that sex difference in the effect of diabetes existed; females with diabetes were compared with healthy counterparts and had greater reduction in peak exercise performance than the group between males with diabetes and their counterparts.
Previous studies show grip strength is related to sex, diabetes, and exercise. There remains gap of evidence whether diabetes influences the association between exercise and HGS and whether there is sex difference as well. By analyzing Korean nationwide population based survey and examination data, the authors sought to find the correlation.
METHODS
Study design and subjects
This study utilized data from the Korean National Health and Nutrition Examination Survey (KNHANES), collected between 2017 and 2019. Conducted annually by the Korean government, KNHANES gathers nationally representative information on health status, nutritional intake, and laboratory values through structured questionnaires and physical examinations [14]. Of the 24,229 participants surveyed during this period, individuals who were under 19 years of age (4,616 participants) or lacked HGS measurements (1,423 participants) were excluded. Then nonresponders for the questionnaire determining diabetes (1,029 participants), exercise (718 participants) were excluded. A total of 16,443 participants were included in the final analysis.
This study was approved by the Institutional Review Board (IRB) of Seoul National University Bundang Hospital (IRB No: X-2511-1007-902). The requirement for informed consent was waived by the IRB because the study was a secondary analysis of de-identified, publicly available data from the KNHANES 2017–2019.
Variables
HGS was assessed using a digital grip strength dynamometer (T.K.K 5401; Takei Scientific Instruments Co., Ltd). It was measured with both hands and three trials were given for each hand. The maximum recorded value was used as the final grip strength. LHGS was defined based on the Asian Working Group for Sarcopenia (AWGS) 2019 criteria: <28 kg for males and <18 kg for females [15].
Aerobic and resistance exercise were assessed based on a cut-off value using the global recommendations on physical activity for health (from World Health Organization) [16]. Aerobic exercise was defined as a 150-minute physical activity with moderate intensity or a 75-minute physical activity with high intensity per week, or an equivalent combination per week. Resistance exercise was defined as engaging in weight training or strength training more than once a week.
Additional variables collected from the survey included body mass index (BMI), alcohol consumption, smoking status, household income, education level, and comorbidities. Obesity was defined using the Asia-Pacific BMI cut-off point of ≥25 kg/m2 [17]. Alcohol drinkers were defined as individuals who consumed any alcohol in the previous year. Household income was represented in quartiles, with the 1st quartile group representing the lowest income group and the 4th quartile group the highest. Comorbidities, such as hypertension, angina, myocardial infarction, and chronic obstructive pulmonary disease (COPD), were considered present if participants reported having been diagnosed by a physician. Among comorbidity, the arthritis was treated as a separate variable. Diabetes was defined as having been diagnosed by a doctor, or based on laboratory criteria: glycated hemoglobin (HbA1c)≥48 mmol/mol, fasting blood glucose≥7mmol/L, or current use of diabetes medications, including insulin.
Data analysis
Bivariate logistic regression was used to assess relationships between LHGS and baseline demographic variables. For the relationship between each type of exercise and LHGS, multivariate logistic regression was performed with an adjustment for confounders. There were significant missing values for the comorbidity COPD (n=4,722). The baseline characteristics was analyzed for the subgroup with missing value for COPD and is added as the Supplementary Table 1. Compared with the baseline participants, this group’s participants were younger (mean age, 47.0 years vs. 30.4 years), had similar proportion of males (50.1% vs. 53.0%), did more aerobic exercise (46.2% vs. 56.1%), did similar resistance exercise (22.8% vs. 26.1%), had higher education level and had less diabetes (10.9% vs. 2.3%).
Because exercise, diabetes, and sex may jointly influence HGS, three-way and two-way interaction terms were prespecified primary analyses. Then, the participants were stratified by diabetes status and sex, and the relationship between exercise and LHGS was assessed. All of the data was handled with a complex survey design. STATA version 16.0 (Stata Corp.) was used for analysis, in which statistical significance was agreed with P-value <0.05.
RESULTS
Table 1 shows the demographic characteristics of participants included in the final analysis and stratified by sex and diabetes. Among the 16,443 participants, 7,308 were males and 9,149 were females. Since this study was based on a complex survey, these participants represented 37,528,400 persons. In both sexes, the weighted mean age was higher for those with diabetes than their counterparts. The mean HGS was greater in males and females without diabetes and they also exercised more, in terms of both aerobic and resistance exercise. The prevalence of diabetes was 10.9%. The proportion of LHGS is 8.8% for males with diabetes, 4.8% for males without diabetes, 25.4% for females with diabetes, and 10.2% for females without diabetes.
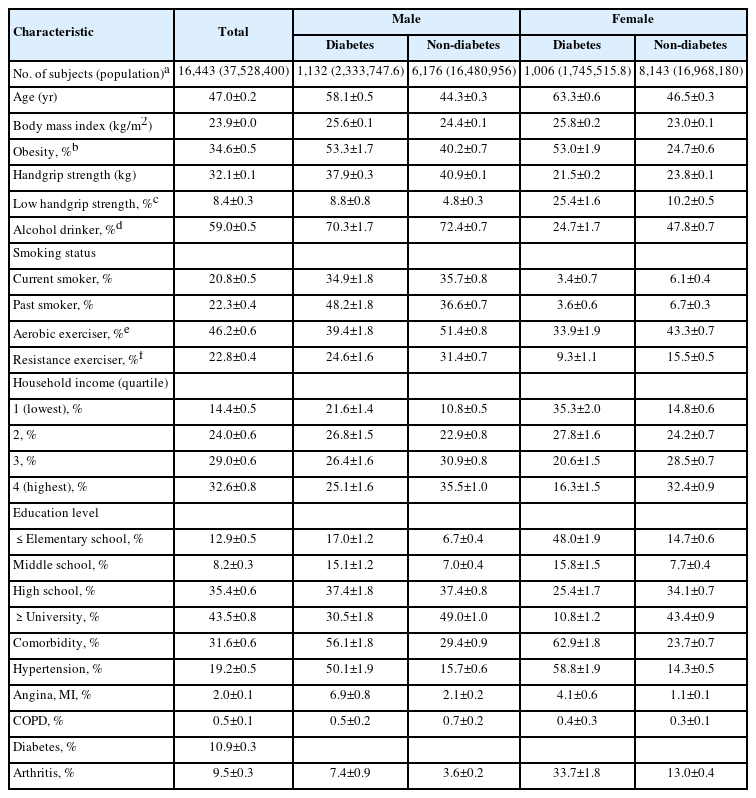
Demographic characteristics of the study subjects
All variables—age, obesity, alcohol consumption, smoking, household income, education level and comorbidity—were associated with LHGS in bivariate analysis and were considered as covariates except exercise and diabetes. In both sexes, aerobic exercise and resistance exercise were related to low prevalence of LHGS, while diabetes was related to high prevalence of LHGS (Table 2).
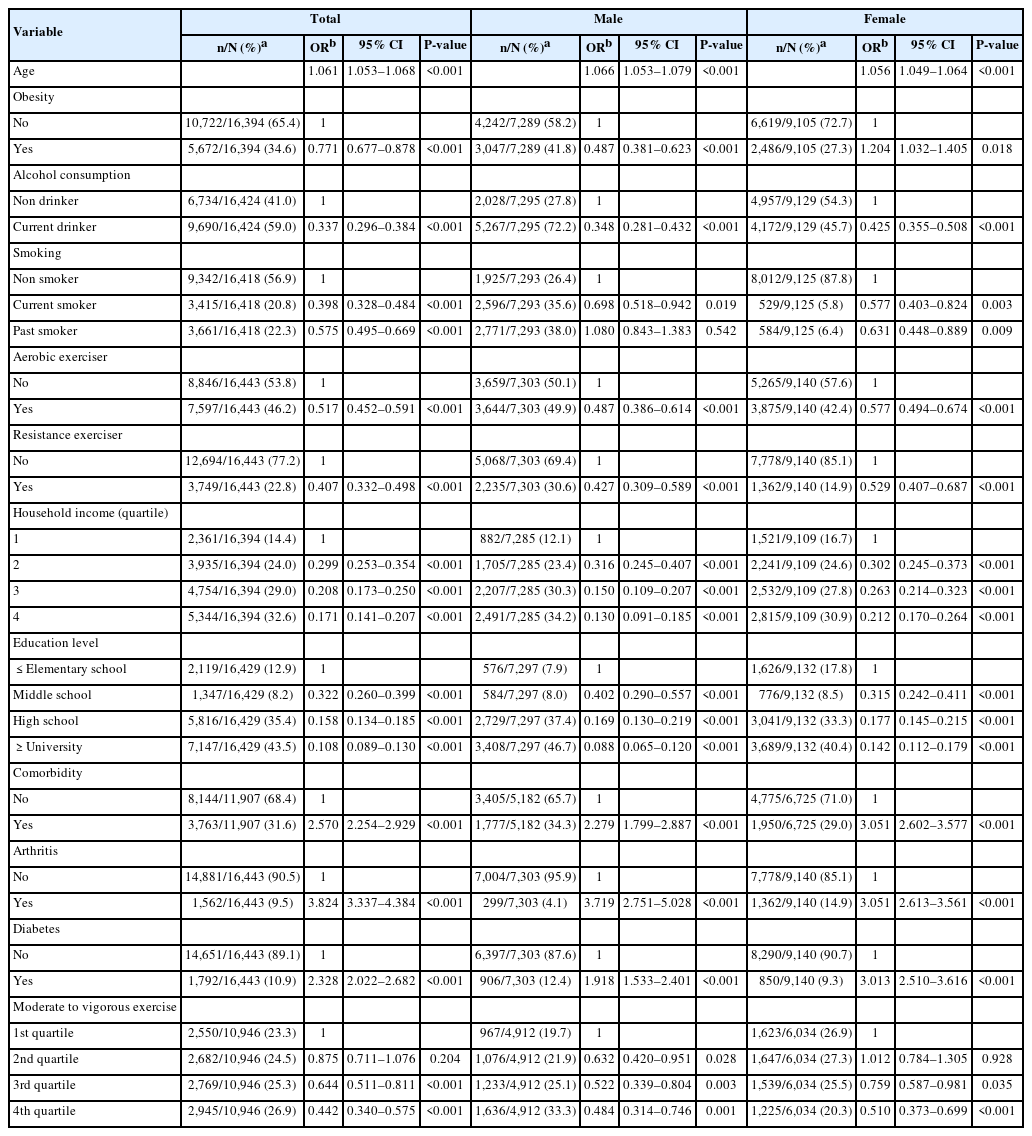
Factors associated with low handgrip strength
A multivariate logistic regression was fit to examine the three-way interaction of exercise, sex, and diabetes. The analysis revealed a statistically significant three-way interaction between aerobic exercise, diabetes and sex (odds ratio [OR] of LHGS=2.350, 95% confidence interval [95% CI]=1.119–4.932) (Table 3). Then, two-way interaction of exercise and diabetes was further analyzed by stratifying sex. The results showed that for males, the interaction between exercise and diabetes was not statistically significant, whereas for females, the interaction between aerobic exercise and diabetes was with OR of LHGS=1.704 and 95% CI=1.073–2.707 (Table 4).
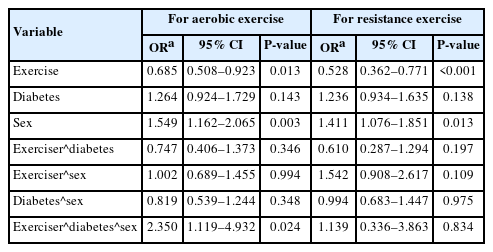
Three-way interaction analysis of exercise, sex, diabetes on the ORs for LHGS
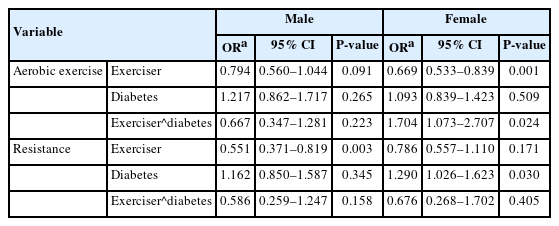
Two-way interaction analysis of exercise type and diabetes stratified by sex on the ORs for LHGS
Subgroup analyses by diabetes status and sex are presented in Table 5. Overall protective effects of exercise were analyzed. The data showed that for males, aerobic and resistance exercise had lower LHGS OR (aerobic, OR of LHGS=0.696 [95% CI=0.535–0.908]; resistance, OR of LHGS=0.488 [95% CI=0.348–0.683]). In females’s case, aerobic exercise had smaller OR for LHGS, but resistance exercise had no significance (aerobic, OR of LHGS=0.744 [95% CI=0.609–0.909]; resistance, OR of LHGS=0.743 [95% CI=0.541–1.021]). Then, protective effects of exercise according to diabetes presence were analyzed. Aerobic exercise in diabetic males was associated with low odds of LHGS, significantly, while it was non-significantly associated in non-diabetic males (diabetic, OR of LHGS=0.479 [95% CI=0.278–0.827]; non-diabetic, OR of LHGS=0.757 [95% CI=0.554–1.035]). In contrast, aerobic exercise in diabetic females was non-significantly associated with LHGS, while it was significantly associated in non-diabetic females (diabetic, OR of LHGS=1.109 [95% CI=0.716–1.719]; non-diabetic, OR of LHGS=0.676 [95% CI=0.539–0.848]). Resistance exercise in males was significantly associated with smaller odds of LHGS, regardless of diabetes status (diabetic, OR of LHGS=0.317 [95% CI=0.165–0.611]; non-diabetic, OR of LHGS=0.536 [95% CI]=0.360–0.798). On the other hand, resistance exercise in females was not significant, regardless of diabetes status (diabetic, OR of LHGS=0.529 [95% CI=0.224–1.249]; non-diabetic, OR of LHGS=0.795 [95% CI=0.564–1.121]).
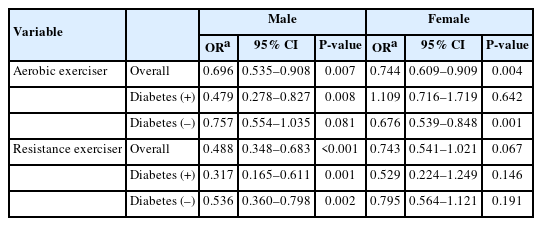
Association between LHGS and type of exercise in relation to diabetes and sex
DISCUSSION
This study reveals important insights into the relationship between physical activity and grip strength, particularly in the context of diabetes status. Our key finding was the significant two-way interaction between aerobic exercise and LHGS among females and not males. Also, the association of aerobic exercise and LHGS was significant in females without diabetes, but not with diabetes. In males, aerobic exercise was significant for diabetics and insignificant for non-diabetics. Resistance exercise was significant for males with or without diabetes and insignificant for females with or without diabetes.
Results of this study are consistent with previous research demonstrating the beneficial impact of exercise on maintaining adequate grip strength. For instance, a British longitudinal cohort study reported that mid-life exercise (ages 40–50 years) was significantly associated with a lower OR for LHGS in early 60s [18]. Similarly, a Korean cross-sectional study found that elderly individuals who exercised regularly had a lower prevalence of LHGS compared to non-exercisers [6]. Our study corroborates these findings, further supporting the general protective effects of both aerobic and resistance exercise on HGS.
As mentioned before, data shows a significant interaction between aerobic exercise and diabetes in females, but not males. Such effect may be due to sex difference in muscle mass that is product of lifetime levels of endogenous sex hormone. Evidence shows that testosterone supplement increased muscle mass in both males and females [19,20].
Another finding is that only aerobic exercise in non-diabetic females was associated with low odds of LHGS. Prior studies suggested that individuals with diabetes had lower aerobic capacity, measured by peak oxygen consumption and maximal walking time [13]. Moreover, when comparing with their non-diabetic counterparts, females with diabetes showed more pronounced decline in cardiorespiratory fitness than males with diabetes [21]. Consequently, even when females with diabetes report meeting exercise guidelines, the intensity or physiological load may not be sufficient to increase strength. This suggests that current exercise recommendations may need to be adjusted for this subgroup, potentially emphasizing greater duration or intensity to maintain grip strength.
Interestingly, in males, the association between ORs of LHGS and aerobic exercise was significant in males with diabetes but not in without diabetes. This could be due to small sample size after stratification. The sample size of males with diabetes was 1,132 and those that participate in aerobic exercise was 39.4%, 446 participants. The sample size of males without diabetes was 6,176 and those that participate in aerobic exercise was 51.4%, 3,174 participants. In males without diabetes, the OR of LHGS for aerobic exercise was 0.75 with P-value of 0.081 and the upper limit of 95% CI of 1.035, which was marginally above “1.” The process of stratification and reducing subgroup sample size, males without diabetes, could have reduced the strength of association between aerobic exercise and OR of LHGS.
Furthermore, association between resistance exercise and ORs of LHGS was significant in males but not in females. The OR of LHGS for resistance exercise in females was 0.743 and the upper limit of 95% CI was 1.021, which was marginally above “1.” These values were similar to the corresponding values for aerobic exercise in the same sex; 0.744 and 0.909. This difference in significance can be explained by the small sample size that participated in resistance exercise in females. According to Table 2, sample size that accounted for males participating in resistance exercise was 2,235 out of 7,303 (30.6%). This size in females was 1,362 out of 9,140 (14.9%). Since there was small number of females participating in resistance exercise compared to males, the association may not have reached statistical significance.
Despite these valuable insights, our study has several limitations. As a cross-sectional study, it is inherently limited in establishing causal relationships. We cannot definitively determine whether exercise reduces LHGS or if LHGS, conversely, limits an individual's ability to engage in exercise. Future longitudinal and interventional studies are crucial to clarify this directionality. Additionally, several key variables, including exercise habits and smoking status, were collected via self-answered questionnaires. While this method carries the potential for reporting bias, it's important to note that the Global Physical Activity Questionnaire, utilized for assessing exercise type and amount, has been validated for predicting actual exercise practice [22]. Similarly, numerous studies have demonstrated the accuracy of self-reported smoking status [23], which somewhat mitigates concerns about bias in this particular variable.
Supplementary material
Comparison of demographic characteristics of the included participants and subgroup with missing values
Notes
AUTHOR CONTRIBUTIONS
Dr. Woo Kyung BAE had full access to all of the data in the study and takes responsibility for the integrity of the data and the accuracy of the data analysis. All authors reviewed this manuscript and agreed to individual contributions.
Conceptualization: JHJ and WKB. Data curation: JHJ. Formal analysis: JHJ and WKB. Investigation: SML. Methodology: EC, SP, HL, and WKB. Project administration: WKB. Writing–original draft: JHJ. Writing–review & editing: SML, EC, SP, HL, and WKB.
CONFLICTS OF INTEREST
No existing or potential conflict of interest relevant to this article was reported.
FUNDING
None.
DATA AVAILABILITY
The data presented in this study are available at https://www.kdca.go.kr/.