

| Korean J Health Promot > Volume 17(1); 2017 > Article |

|
Tel: +82-51-240-7834, Fax: +82-51-242-8671, yujkim@pusan.ac.kr
ABSTRACT
Background
Methods
Results
REFERENCES
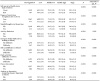
Table┬Ā1
General characteristics and health behaviors according to house hold income groups aged over 35 years women.
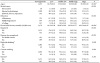
Values are presented as unweighted number.
Continuous variables: estimated mean┬▒SE, Categorical variables: % (SE).
P values are obtained by cross tabulation analysis (Rao-Scott chi-square test) in complex sample design.
aP values are obtained by general linear regression model in complex sample design.
bHigh risk drinking for women is defined as more than twice a week.
cExercise is defined as high intensity exercise 20 minutes more than 3 times per week or moderate intensity exercise 30 minutes more than 5 times per week or walking 30 minutes more than 5 times per week.
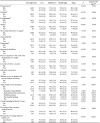
Table┬Ā2
Morbidity, health status, health care utilization according to house hold income groups aged over 35 years women.
Table┬Ā3
Anthropometric measurement and biochemical factors according to house hold income groups aged over 35 years women.
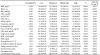
Abbreviations: BMI, body mass index; SBP, systolic blood pressure; DBP, diastolic blood pressure; GOT, glutamic oxalacetic transaminase; GTP, glutamic pyruvate transaminase; BUN, blood urea nitrogen; LDL-chol, low density lipoprotein cholesterol; HDL-chol, high density lipoprotein cholesterol; FBS, fasting blood sugar.
Values are presented as unweighted number (estimated mean┬▒SE).
P values are obtained by general linear regression model in complex sample design.
aAssessed by logistic regression analysis.
Table┬Ā4
Number of cardiovascular disease risk according to house hold income groups aged over 35 years women.
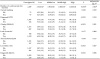
Abbreviation: HTN, hypertension; BMI, body mass index; HDL-chol, high density lipoprotein cholesterol.
Values are presented as unweighted number.
Continuous variables: estimated mean┬▒SE, Categorical variables: % (SE).
P values are obtained by cross tabulation analysis (Rao-Scott chi-square test) in complex sample design.
aAssessed by logistic regression analysis
bP values are obtained by general linear regression model in complex sample design.
cLack of exercise is defined as not doing high intensity exercise 20 minutes more than 3 times per week or moderate intensity exercise 30 minutes more than 5 times per week or walking 30 minutes more than 5 times per week.
 PDF Links
 PubReader
 ePub Link
 Full text via DOI
 Download Citation
 Print
Print


-
METRICS

-
- 7 Crossref
- 0 Scopus
- 2,022 View
- 2 Download
- Related articles
- Editorial Office
-
Department of Family Medicine, Asan Medical Center, 88, Olympic-ro 43-gil, Songpa-gu, Seoul 05505, Korea
Tel: +82-2-3010-3820 Fax: +82-2-3010-3815 E-mail: kshpdp@amc.seoul.kr
Copyright © 2026 by Korean Society For Health Promotion And Disease Prevention.
