The Association between Self-Rated Health and Body Weight Image among Korean Adolescents
Article information
Abstract
Background
Self-rated health (SRH) is crucial for predicting morbidity and mortality across age groups, including adolescents and adults. Body image dissatisfaction, measured by difference between current and ideal weight, surpasses body mass index (BMI) in predicting health outcomes. We evaluated the correlation between body image perception and SRH among middle and high school students in Korea.
Methods
This study comprised of 51,850 students aged 12–18 years who participated in the 2022 Korea Youth Risk Behavior Survey. Subjective health status was categorized into ‘good’ or ‘poor’ groups. Body image was classified into ‘underweight,’ ‘normal,’ or ‘overweight.’ BMI was determined using age-specific percentiles: underweight (<5th percentiles), overweight (85th–95th percentiles), and obese (>95th percentiles). Data analysis was performed by multivariable logistic analysis and adjusted for depressive mood, stress, and socioeconomic status.
Results
The total participants (N=50,455) included 59.4% with normal weight according to BMI, only 36.4% perceived themselves as normal. Students who perceived themselves as having a normal weight had higher rates of good SRH compared to others. Excluding females with BMI ≥25 kg/m2, both sex showed higher odds ratios [ORs] for poor SRH when perceiving themselves overweight (male: OR=2.57, 95% confidence interval [95% CI]=2.367–2.782; female: OR=1.36, 95% CI=1.270–1.452) or underweight (male: OR=1.64, 95% CI=1.507–1.791; female: OR=1.36, 95% CI=1.256–1.472).
Conclusions
More than half of the students responded negatively to their body image, associated with poor subjective health status. Therefore, promoting accurate body weight perceptions will play a positive role in overall health of adolescents.
INTRODUCTION
The World Health Organization (WHO) defines health as a state of complete physical, mental, and social well-being, emphasizing the health is not merely the absence of disease. Currently, the concept of health is generally regarded as encompassing both physical and psychological dimensions [1]. Self-rated health (SRH) is a self-reported health measure that evaluates an individual’s integrated perception of health, which is inaccessible to external observers [2-4]. Despite its inherently subjective nature, SRH provides a systematic assessment of health across biological, psychological, and social domains and can reflect overall health more sensitively than external measurements. Furthermore, it demonstrates strong predictive validity for morbidity and mortality and has therefore been widely used since the 1950s to assess population health status [5].
Adolescence is a critical developmental period characterized by rapid physical changes and heightened self-consciousness regarding body image. During this stage, how adolescents perceive their body shape―whether they consider themselves underweight, normal, or overweight―can strongly influence their psychological well-being and health perception [6]. Body image dissatisfaction and weight misperception are prevalent among adolescents and are known to contribute to depressive symptoms, low self-esteem, and disordered eating behaviors [7,8]. In particular, several studies among Korean adolescents have reported significant associations between self-perceived weight and SRH, suggesting that subjective body perception may play a critical role in adolescents’ health evaluation [8,9].
Previous studies have suggested that subjective perceptions of body weight may be more closely related to SRH than objective measures such as body mass index (BMI) [9]. For instance, adolescents who perceive themselves as overweight or underweight then report poorer SRH regardless of their actual BMI. This implies that subjective body image may serve as a psychosocial determinant of perceived health that operates independently of objective body weight.
Body image dissatisfaction arises from psychological and emotional factors, social norms, and distorted body perceptions [10]. It begins after the preschool years, when children begin to recognize their body shape, peaks during adolescence due to rapid physical changes, and remains relatively stable in adulthood [11]. In the 2010 Korea Youth Risk Behavior Web-based Survey (KYRBS), 19.3% of adolescents who attempted weight loss reported using inappropriate methods, indicating that a considerable proportion of Korean adolescents have long perceived their body shape in a biased manner [11].
Given the increasing prevalence of body image distortion and its potential impact on adolescents’ mental and physical health [12,13], it is crucial to understand how perceived body image relates to SRH. Using data from the 2022 KYRBS, this study aimed to examine the association between adolescents’ subjective body image perception and their SRH status.
METHODS
Study participants
This study used data from the 2022 KYRBS, conducted by the Korea Disease Control and Prevention Agency between August 29 and October 25, 2022. The KYRBS is an annual, nationwide survey of students from the first year of middle school to the third year of high school. The sampling process involves stratification of the target population, sample allocation, and multistage cluster sampling. For the 2022 survey, 17 provinces and metropolitan cities were stratified into 539 regional clusters. Schools were selected to achieve a 50:50 ratio between middle and high schools, resulting in a total of 800 sample schools nationwide. Ultimately, 51,850 students from grades 7 to 12 participated in the survey. After excluding 1,395 students who did not report their height and weight, making BMI calculation impossible, 50,455 participants were included in the final analysis. There were no participants with missing responses for SRH or perceived body image.
Study variables and definitions
BMI was calculated using self-reported height and weight. In adolescents, BMI is interpreted based on age- and sex-specific growth charts rather than adult cutoffs. According to the WHO, obesity is defined as a BMI ≥2 standard deviations above the median for age and sex [14]. In Korea, the 2017 Korean National Growth Charts classify underweight as a BMI below the 5th percentile, overweight as a BMI between the 85th and 95th percentiles, and obesity as a BMI at or above the 95th percentile for age and sex [15]. Since 2017 Korean National Growth Charts reflect population-specific growth patterns and percentile cutoffs that better represent Korean adolescents than the WHO reference, these criteria were adopted in this study. Participants were categorized into four groups: underweight, normal weight, overweight, and obese.
Perceived body image was assessed through the question, “How do you perceive your body shape?” Responses of “very thin” and “somewhat thin” were classified as underweight perception; “normal” as normal perception; and “somewhat fat” and “very fat” as overweight perception. SRH was assessed with the question, “How would you describe your usual health status?” Responses of “very healthy” and “healthy” were classified as good, while “fair,” “unhealthy” and “very unhealthy” were classified as poor. Stress was assessed using the question, “How much stress do you usually feel?” Responses of “very much” and “much” were categorized as high stress, while “some,” “little,” and “none” were categorized as low stress. Depressive symptoms were identified by using the question. “During the past 12 months, have you ever felt so sad or hopeless almost every day for 2 consecutive weeks or more that you stopped doing some usual activities?” Responses were categorized as yes or no. Socioeconomic status (SES) was determined by the question, “What is your family’s economic status?” Responses were “high” and “middle-high” were classified as high SES. “Middle” as middle SES, and “middle-low” and “low” as low SES.
Statistical analysis
All analyses were performed using SPSS Statistics version 27.0 (IBM Crop.). Descriptive statistics, including frequencies and percentages, were calculated for perceived body image and BMI categories. Chi-square tests were used to examine the association between each variable and SRH. Multivariable logistic regression analyses were then conducted to assess the association between perceived body image and SRH while adjusting for depressive symptoms stress level, and SES. Statistical significance was determined using two-sided P-values <0.05.
Ethics approval
This study used data from the KYRBS, which are publicly available and fully deidentified. Therefore, institutional review board review and informed consent were not required in accordance with national regulations.
RESULTS
General characteristics of the study participants
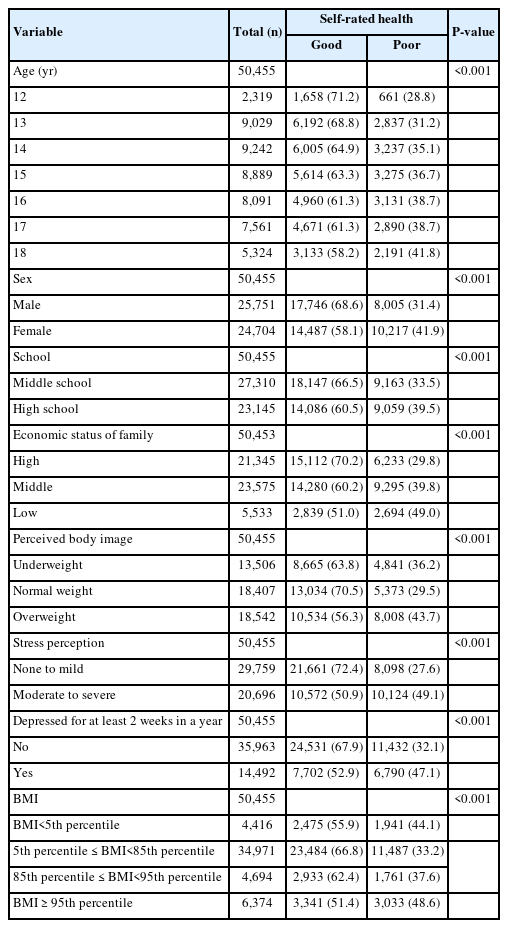
Table 1 presents the general characteristics of the study participants. Among the total sample 25,751 (51.7%) were male and 24,702 (48.3%) were female. The proportion of adolescents reporting poor SRH was significantly higher among females (10,217 [41.9%]) than males (8,005 [31.4%]). Based on BMI, 4,416 participants (9.0%) were underweight, 34,971 (69.7%) were normal weight, 4,694 (0.15) were overweight, and 6,374 (12.2%) were obese.
In terms of perceived body image, 13,506 participants (27.2%) considered themselves underweight, 18,407 (36.7%) normal, and 18,542 (36.2%) overweight. The proportion reporting poor SRH was 36.2% among those perceiving themselves as underweight, 29.5% among those perceiving normal weight, and 43.7% among those perceiving overweight, with the highest prevalence in the overweight perception group.
Depressive symptoms were reported by 14,492 participants (28.6%), while 35,962 (71.4%) reported no depressive symptoms. The prevalence of poor SRH was significantly higher among those with depressive symptoms.
SES also showed a clear gradient: 21,345 participants (43.4%) reported high SES, 23,575 (46.2%) middles SES, and 5,533 (10.4%) low SES. The proportion with poor SRH rose steadily across these groups: 29.8%, 39.8%, and 49.0%, respectively (P<0.001).
Self-reported body image and body mass index in relation to self-rated health
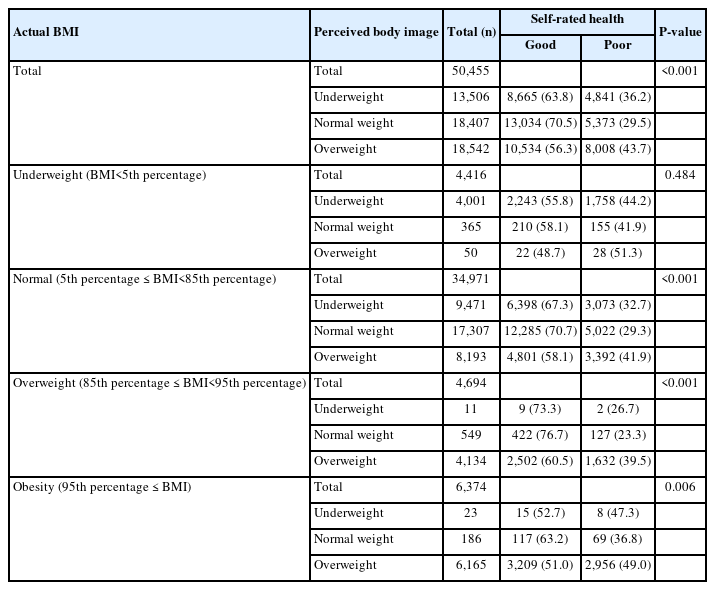
As shown in Table 2, among the 50,455 participants, 6,374 (12.2%) were obese by BMI, but 18,542 (36.2%) perceived themselves as obese―roughly three times the actual prevalence.
Among adolescents classified as underweight by BMI, most (4,001 [90.6%]) perceived themselves as underweight, while 8.3% (365 participants) saw themselves as normal and 1.1% (50 participants) as overweight. Across these groups, 40%−50% reported poor SRH.
Among those with a normal BMI, 27.2% (9,471 participants) perceived themselves as underweight, 49.5% (17,307 participants) as normal, and 23.3% (8,193 participants) as overweight. The prevalence of poor SRH was 32.7%, 29.3%, and 41.9% respectively; adolescents perceiving themselves as underweight or overweight showed significantly higher rates compared with those perceiving normal weight (P<0.001).
Similar patterns appeared in the overweight and obese BMI groups (P<0.001 and P=0.006, respectively). Except for the underweight BMI group, adolescents with weight misperception, perceiving themselves as underweight or overweight when their BMI was normal, consistently reported poor SRH more often than those with accurate weight perception.
Sex-specific associations between body image perception and self-rated health
Male adolescents
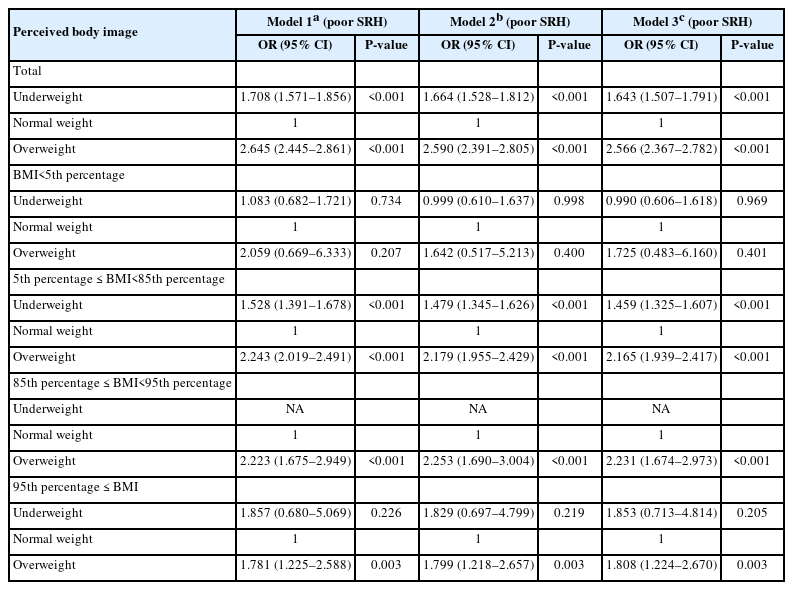
Among male adolescents, those with a body image perception other than normal had higher odds of reporting poor SRH compared with those perceived themselves as normal (Table 3). After adjusting for depressive symptoms, stress level, and SES, the odds of reporting poor SRH remained significantly elevated: odds ratio (OR)=1.64 (95% confidence interval [95% CI]=1.51−1.79) for those perceiving themselves as underweight and OR=2.57 (95% CI=2.37−2.78) for those perceiving themselves as overweight.
Within the subgroup of males with a normal BMI, adolescents perceiving themselves as underweight or overweight showed significantly greater odds of poor SRH compared with those perceiving normal weight. ORs that were unstable or approached zero were reported as “NA” (not applicable).
Female adolescents
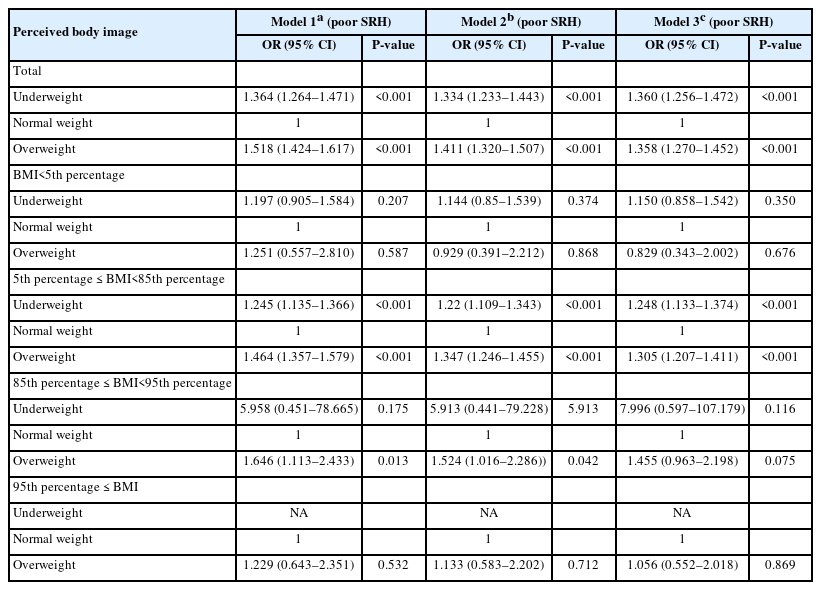
Findings among female adolescents were like those in males (Table 4). After adjustment for depressive symptoms, stress level, and SES, the odds of reporting poor SRH were significantly higher in those perceiving themselves as underweight (OR=1.36, 95% CI=1.26−1.47) and those perceiving themselves as overweight (OR=1.36, 95% CI=1.27−1.45) compared with those perceiving normal weight.
Among females with a normal BMI, perceiving oneself as underweight or overweight was also associated with significantly increased odds of poor SRH compared with perceiving normal weight.
DISCUSSION
In this nationally representative sample of Korean adolescents, those who perceived their body image as underweight or overweight had higher odds of reporting poor SRH compared with those who perceived their body image as normal. This association remained significant in both boys and girls, even among adolescents with a normal BMI, indicating that subjective body image perception influences perceived health independently of objective weight status.
These findings suggest that adolescents’ self-perceived body image functions as a psychosocial determinant of perceived health, rather than merely reflecting objective BMI. Whereas BMI represents a physiological indicator of adiposity, perceived body image encompasses psychosocial and sociocultural dimensions of how individuals evaluate their own bodies. Therefore, the observed association between distorted body image and poor SRH highlights the importance of addressing the cognitive and emotional components of health beyond objective anthropometric measures. Taken together, our results indicate that subjective body image may outweigh BMI as a predictor of SRH [9], underscoring the need for public health strategies that target adolescents’ perceptions and attitudes toward their bodies, rather than focusing solely on physical weight status.
This study is meaningful in that it examined the relationship between body image perception and SRH using large-scale, nationally representative data. SRH is known to be one of the strongest predictors of healthcare utilization, medical costs, and mortality, and poor SRH in adolescence has been reported to influence health outcomes in adulthood [16,17].
Our findings are consistent with previous research conducted in young, middle-aged, and general adult populations, which also demonstrated that inaccurate or dissatisfied body image is associated with worse SRH [18-20]. This study extends these findings to Korean adolescents.
Some subgroups showed limited associations, largely due to very small sample sizes. For example, among boys who were overweight by BMI but perceived themselves as underweight, and among girls who were obese by BMI but perceived themselves as underweight, the association between body image perception and SRH was weak or absent. However, these groups contained only a negligible number of participants, making reliable interpretation difficult. The associations between perceived body image and SRH were most evident among adolescents with normal BMI for both sexes (Table 2–4). This pattern may be explained by the substantially larger sample size in this group, which provided greater statistical power to detect differences. In contrast, subgroups showing the largest discrepancies between actual BMI and perceived weight―such as underweight adolescents perceiving themselves as overweight or obese adolescents perceiving themselves as underweight―did not exhibit significant associations. These non-significant findings may be attributed to the small number of participants and wide confidence intervals, suggesting limited precision rather than a true lack of association. Alternatively, adolescents in these extreme mismatch groups may have developed psychological adaptation or denial mechanisms that buffer the perceived impact on SRH [21,22]. Future studies with larger samples or longitudinal designs are warranted to clarify whether these results reflect limited power or genuine null relationships.
Beyond SRH, body image perception has been linked to broader aspects of mental well-being. Previous studies have reported positive correlations between body satisfaction and self-esteem in both sexes, while adolescents with distorted body images are more likely to engage in weight-control behaviors and exhibit higher rates of depression and suicidal ideation [23,24].
One potential mechanism underlying these associations is identity confusion, in which negative early-life experiences contribute to fragile self-identity and internalization or unrealistic ideals, leading to dissatisfaction [25]. Additionally, increased exposure to manipulated images through social networking services (SNS) may promote upward social comparison and negative body image [26]. Further research is warranted to clarify the determinants of body image formation during adolescence. In addition, future research should employ longitudinal designs to elucidate causal pathways between body image perception and SRH, and explore potential mediating factors such as self-esteem, social comparison, and media exposure. Studies integrating both psychological and behavioral dimensions may help develop more effective interventions for improving adolescents’ body image and perceived health.
Interventions aimed at improving body image and strengthening self-identity may help adolescents develop a more positive perception of their bodies. Since poor SRH was observed even among adolescents with normal BMI when body image perception was inaccurate, reliance on BMI alone is insufficient for assessing adolescents’ health. Educational programs that foster a positive body image have been shown to buffer the negative effects of idealized media portrayals [27]. Even peer-delivered programs, such as those conducted by university students, have been shown to reduce body dissatisfaction among adolescents [28]. Internationally, several initiatives address body image concerns―for instance, the United Kingdom’s All-Party Parliamentary Group on Body Image has proposed national policies [29], and the Dove Self-Esteem Project with its “Confident Me” has been implemented globally to promote positive body image among youth [30,31].
This study has several limitations. First, BMI was calculated from self-reported height and weight, which may introduce measurement error. Second, because this was a cross-sectional analysis, causality between body image perception and SRH cannot be established.
Conclusion
This study evaluated SRH according to body image perception among Korean adolescents and found that inaccurate or dissatisfied body image was associated with poor SRH. Given the long-term impact of adolescents’ SRH on adulthood, effective strategies to promote accurate and positive body image in youth are needed.
Notes
AUTHOR CONTRIBUTIONS
Dr. Sung SUNWOO had full access to all of the data in the study and takes responsibility for the integrity of the data and the accuracy of the data analysis. All authors reviewed this manuscript and agreed to individual contributions.
Conceptualization: JAL. Data curation: JAL. Formal analysis: YS. Methodology: JAL. Project administration: SS. Resources: JAL. Supervision: JAL and SS. Validation: YS. Writing–review & editing: all authors.
CONFLICTS OF INTEREST
No existing or potential conflict of interest relevant to this article was reported.
FUNDING
None.
DATA AVAILABILITY
The data presented in this study are available upon reasonable request from the corresponding author.


