The Relationship between Dietary Pattern and Sleep Apnea: A Study Using Recommended Food Score and Berlin Questionnaire
Article information

Abstract
Background
Sleep apnea, characterized by interruptions in breathing during sleep, presents health risks and has been associated with various dietary patterns. This study aimed to investigate the relationship between dietary patterns, as measured by the Recommended Food Score (RFS), and the risk of sleep apnea, as assessed using the Berlin Questionnaire.
Methods
A total of 11,586 adults from a general hospital in Korea were included in the analysis. Participants completed a questionnaire covering demographic factors, lifestyle behaviors, and dietary habits. Dietary quality was assessed using the RFS, while sleep apnea risk was evaluated using the Berlin Questionnaire. Logistic regression analysis was conducted to assess the impact of RFS on sleep quality, adjusting for potential confounding factors.
Results
Higher RFS was negatively correlated with sleep apnea risk (odds ratio=0.91 [95% confidence interval, 0.82–1.00, P=0.048]). Significant positive associations were observed between male sex, low education level, marital status, smoking, drinking, inactivity, high blood pressure, high waist circumference, high levels of triglycerides, and poor sleep quality. Hematologic markers such as C-reactive protein levels and glutamic pyruvic transaminase also displayed significant associations with sleep quality.
Conclusions
This study contributes to our understanding of the complex interplay between diet, lifestyle, metabolic health, and sleep quality. These findings underscore the importance of dietary interventions in managing sleep apnea and highlight avenues for further research.
INTRODUCTION
Sleep apnea is a disorder that causes people to stop breathing while asleep. This happens either because of blockage of an airway or because the brain does not correctly control breathing [1].
Recent studies have indicated that certain dietary patterns may influence the likelihood of developing sleep apnea [2,3]. The connection between diet and sleep apnea is complex and multifaceted. Factors such as excessive weight, inflammation, and metabolic dysfunction are believed to interact with dietary choices and contribute to the development and severity of sleep apnea [4-6]. While there is growing interest in the potential link between dietary patterns and sleep apnea, it is important to recognize that there is currently no consensus in the scientific community regarding the impact of diet on the development and severity of sleep apnea. Some studies have suggested that certain dietary patterns, such as a high intake of calories, salt, and Mediterranean dietary intervention may be associated with an increased risk of sleep apnea [7-12]. However, the current body of research remains insufficient, particularly in terms of the number of studies and the availability of observational data for conducting randomized controlled trials (RCTs). Additionally, research on dietary interventions is limited to investigations focusing on the Mediterranean diet [2].
Furthermore, the multifaceted nature of sleep apnea, which involves complex interactions between physiological, anatomical, and behavioral factors, makes it challenging to isolate the specific effects of diet on this sleep disorder [6,13-15].
In this study, we aimed to investigate the relationship between dietary patterns, as measured by the Recommended Food Score (RFS), and the risk of sleep apnea, as assessed using the Berlin Questionnaire (BQ). By examining these factors, we hope to determine the potential influence of diet on sleep apnea and contribute to the development of dietary interventions for individuals at risk.
METHODS
Participants
This study analyzed a total of 11,586 out of 23,042 adults who visited Seoul Metropolitan Government–Seoul National University (SMG–SNU) Boramae Medical Center’s health examination center in Korea from October 13, 2014 to March 12, 2020, excluding 11,456 individuals who did not respond to the questionnaire or had missing values for major variables or participants who visited multiple times (Fig. 1). The study was approved by the Institutional Review Board of (IRB) at SMG–SNU Boramae Medical Center (IRB No. 20-2023-56).
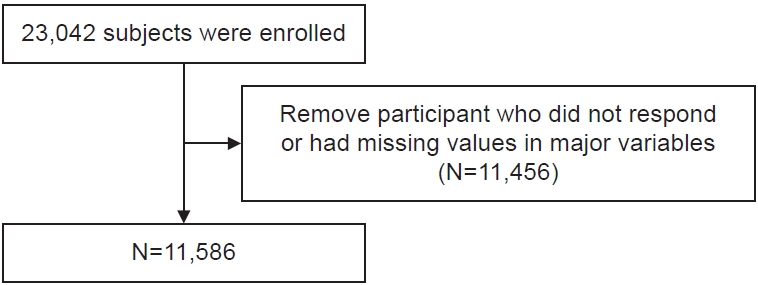
Flowcharts for the study subjects.
General characteristics and anthropometric measurements
During visits to the health examination center, participants completed a questionnaire covering educational background, marital status, income, smoking status, drinking status, the BQ, and dietary habits. The questionnaire also examined aspects such as medical history, and medication usage. Body mass index was determined by measuring height and weight using an automatic height/weight meter. Waist circumference was measured in an upright position with light breath at the midpoint between the lowermost end of the rib and the uppermost end of the hip flexor. Fasting blood glucose, glycated hemoglobin, total cholesterol, triglycerides, and high-density lipoprotein (HDL) cholesterol were measured after an overnight fast of at least 8 hours. The classification of metabolic syndrome was determined based on whether individuals met certain criteria, including fasting blood sugar, blood pressure, waist circumference, HDL cholesterol, and triglyceride levels. The presence or absence of exercise is determined by categorizing individuals based on whether they reported engaging in exercise above moderate intensity.
Dietary assessment
This study assessed overall diet quality using the RFS developed by Kant et al. [16]. This food-based metric evaluates adherence to established dietary guidelines. However, to better capture the nuances of the Korean diet, the modified RFS, as suggested by Kim et al. [17], was used in this investigation. This modified version encompasses a variety of food items, such as mixed grains, beans, vegetables, seaweed, fruits, seafood, dairy products, and nuts.
The RFS was calculated based on the following food items and their assigned points: daily meal frequency (1 point), grains (1 point), legumes (4 points), vegetables (17 points), seaweeds (2 points), fruits (12 points), fish (5 points), dairy products (3 points), nuts (1 point), and tea (1 point). A total of 46 foods or food groups consistent with recommended dietary guidelines were considered. Participants earned one point for each recommended food or regular eating pattern (three meals per day) if they consumed the food at least once per week. The total score ranged from 0 to 47 points, with higher scores indicating better diet quality [18] (Supplementary Table 1).
To simplify the analysis, the RFS was categorized into two groups: less than 23 points and 23 points or higher. A median score of 23 was used to establish this distinction. This classification was based on differentiating the group with a score of 23 or higher as having good overall meal quality, while the group with less than 23 points was considered to have poor meal quality.
Sleep apnea symptom assessment
The BQ was used to assess sleep quality. This validated questionnaire comprises 10 items grouped into three categories: snoring behavior and sleep apnea symptoms, daytime sleepiness, and history of hypertension and/or obesity. Participants were categorized as having high or low risk of sleep-disordered breathing based on their responses [19].
Statistical analysis
The characteristics of the two groups were examined and compared using t-tests and chi-square tests. This analysis aimed to identify any significant differences in the sex distribution of the study participants.
Logistic regression analysis was conducted to evaluate the impact of the RFS on sleep quality. Variable adjustment was implemented to isolate the specific effects of RFS on sleep quality, while controlling for other factors. Significance was determined by adjusting for variables such as sex, age, education level, marital status, income, smoking status, alcohol consumption, engagement in moderate-intensity exercise, fasting blood sugar levels, blood pressure, waist circumference, lipid levels, inflammation levels, and liver function. The adjusting variables are specifically defined in Table 1.
Demographics of the study sample
The statistical analysis was performed using R (version 4.2.2, R Foundation for Statistical Computing). A P-value of <0.05 was considered to indicate statistical significance.
RESULTS
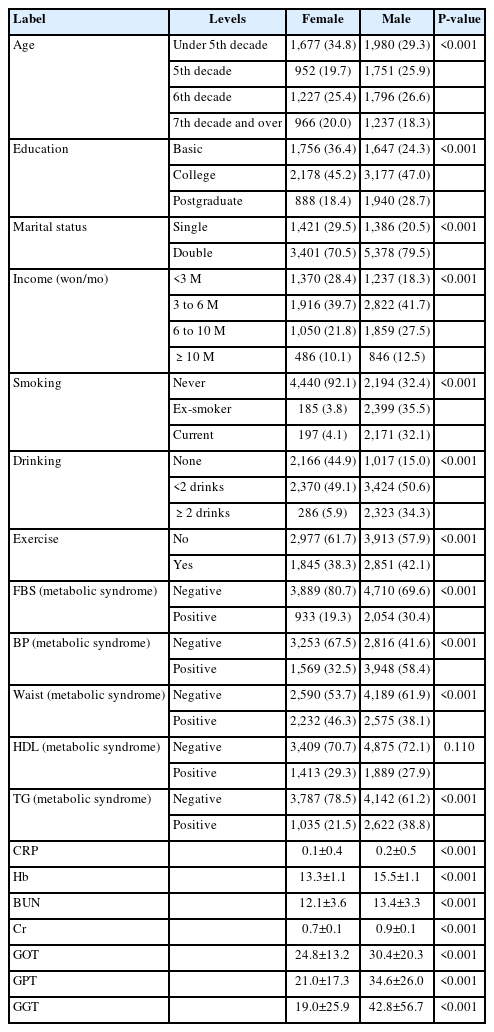
Table 1 presents an analysis and description of the characteristics of the study subjects. The majority of the participants were under the age of 50, and a significant proportion held college degrees. Sex differences were also observed. Males were more likely to smoke, consume alcohol, and exhibit greater blood pressure than females. Additionally, differences were noted in liver function test results between males and females.
Table 2 shows the associations between various variables, including the RFS (odds ratio [OR]=0.91 [95% confidence interval, 0.82–1.00, P=0.048]), sex, age, education, marital status, income, smoking status, alcohol consumption status, exercise status, fasting blood sugar, and blood pressure, and the BQ score in the low- and high-risk categories. ORs are provided for both univariable and multivariable analyses.
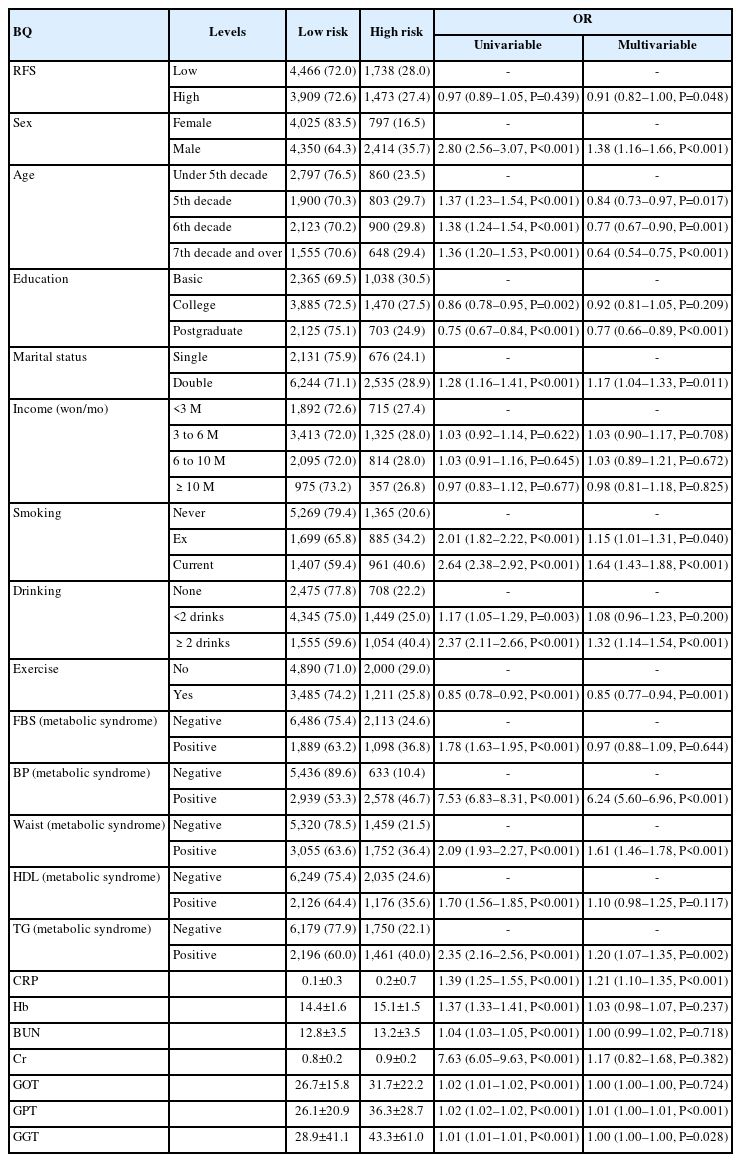
Associations between variable and BQ
While the RFS did not exhibit statistical significance in the univariate analysis of the BQ score, a statistically significant negative correlation emerged when adjusted for other factors. Moreover, significant correlations were observed with sex, age, education level, current smoking status, alcohol consumption, and engagement in exercise above moderate intensity. Metabolic syndrome parameters, including blood pressure, waist circumference, and triglyceride levels, also showed a positive correlation with BQ categories. In the hematologic marker analysis, significant differences were noted in C-reactive protein (CRP) levels and liver function test results (Table 2).
The OR of the BQ tended to be less than 1 when the RFS, the primary variable of this study, belonged to the group with a score of 23 or higher. Moreover, the OR tended to be greater in males, while it decreased with older age and higher educational attainment. Current smoking and alcohol consumption of more than two drinks per day were associated with increased OR values, whereas engaging in moderate-intensity exercise was linked to lower OR values. Variables related to metabolic syndrome, CRP levels, and glutamic pyruvic transaminase (GPT) also demonstrated statistically significant associations, with higher values (Fig. 2).
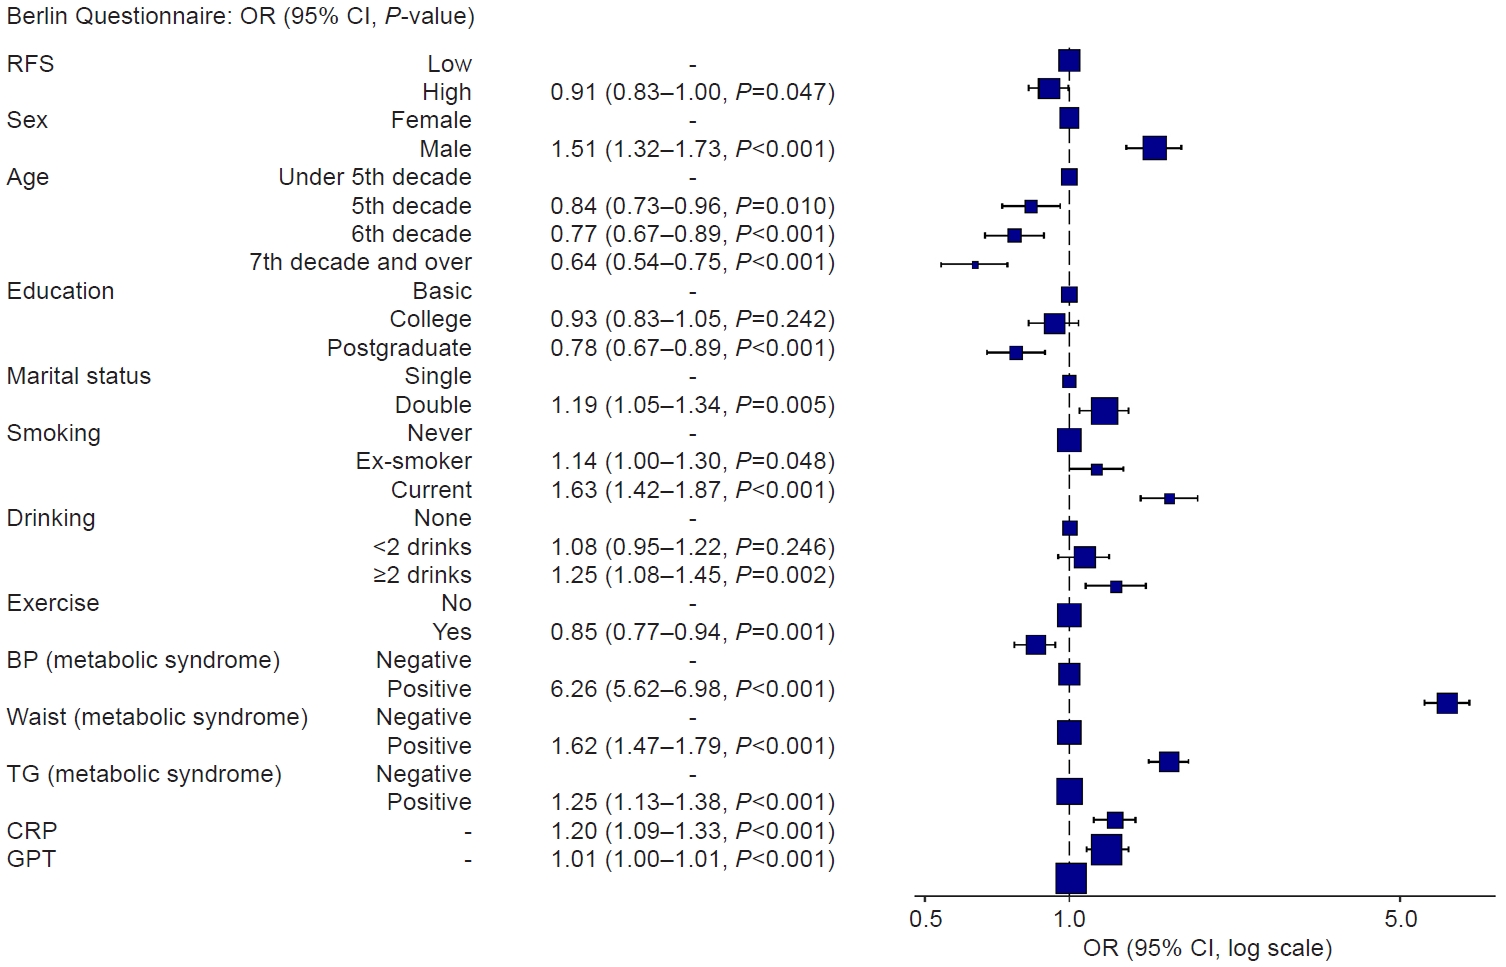
Forest plot of significant variables. BP, blood pressure; CI, confidence interval; CRP, C-reactive protein; GPT, glutamic pyruvic transaminase; OR, odds ratio; RFS, Recommended Food Score; TG, triglyceride.
DISCUSSION
This study investigated the association between dietary patterns and sleep apnea risk and revealed a negative correlation between a higher RFS and sleep apnea risk.
Consistent with previous literature, sex and education level also showed significant associations with sleep quality. Males tended to have greater odds of exhibiting sleep-disordered breathing, while higher educational attainment appeared to be protective against these symptoms. These findings align with existing research on the demographic factors influencing sleep patterns and sleep disorders [20].
In addition to diet quality, lifestyle factors such as smoking and alcohol consumption demonstrated associations with sleep quality. Current smoking and frequent alcohol consumption were linked to elevated odds of sleep-disordered breathing, highlighting the detrimental impact of these habits on sleep quality [13-15]. Conversely, engagement in moderate-intensity exercise has been shown to have a protective effect against sleep apnea symptoms [6].
Furthermore, the study revealed positive correlations between metabolic syndrome components, particularly blood pressure, waist circumference, and triglyceride levels, and the risk of sleep-disordered breathing. This shows the interconnection of metabolic health and sleep quality, emphasizing the importance of addressing underlying metabolic factors in the management of sleep disorders [21,22].
Notably, hematologic markers, including CRP levels and GPT, displayed significant associations with sleep quality, indicating potential links between inflammation, liver function, and sleep disturbances. These findings warrant further investigation into the mechanistic pathways underlying these associations and their implications for clinical management [23,24].
Several hypotheses can be considered regarding the possible mechanisms underlying the association between dietary quality and sleep apnea. First, the composition of a nutrient-rich, high-quality diet may play a role in promoting overall health, including improvements in sleep quality [3]. Second, a high-quality diet may act as a predisposing factor related to metabolic syndrome or weight management [21]. Additionally, these dietary patterns have been associated with antioxidant activity, which could influence sleep health, along with changes in the composition of intestinal microorganisms [25,26] (Fig. 3). Finally, other lifestyle factors also contribute to the complex interaction between diet and sleep health [27-29].
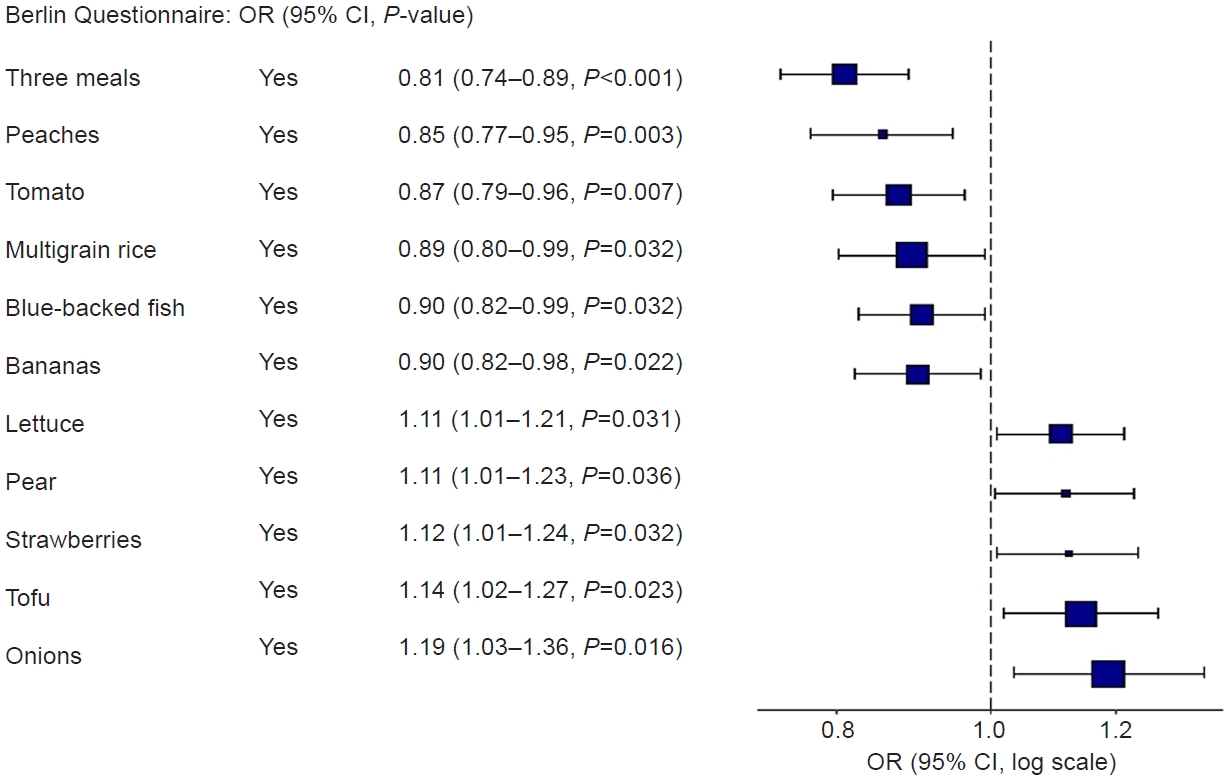
A significant association between each RFS question and Berlin Questionnaire. CI, confidence interval; OR, odds ratio; RFS, Recommended Food Score.
In this study, univariate analysis revealed a correlation between increasing age and a greater risk of developing sleep apnea, reflecting the elevated prevalence of this condition among older age groups. This observation aligns with the general understanding that advancing age is associated with physiological changes, including decreased muscle tone, increased fatty tissue around the airway, and decreased respiratory function. These age-related changes can collectively contribute to the development of obstructive sleep apnea [30]. However, as demonstrated in this study, when health-related variables that may vary with age are included and analyzed, age alone does not emerge as an independent risk factor for sleep apnea. This finding suggests that physiological changes associated with aging, such as increased blood pressure and alterations in waist circumference, as well as health behaviors such as smoking, drinking, and exercise, may play more significant roles in the onset of sleep apnea than age itself. With the inclusion of several clinical variables that are influenced by age in the analysis, age may have diminished significance in the occurrence of sleep apnea.
The strength of this study lies in its ability to enhance generalizability through the recruitment of a substantial number of visitors from the actual health center. Additionally, the inclusion of hematologic markers, such as CRP levels and liver function test results, provides depth to the study’s findings by revealing potential links between inflammation, liver function, and sleep disturbances. These associations contribute to a holistic assessment of factors influencing sleep health, thereby expanding the study’s scope beyond traditional dietary and lifestyle measures. Moreover, the recognition of significant factors such as sex, age, education level, smoking status, alcohol consumption, and engagement in exercise demonstrates the comprehensive consideration of various determinants of sleep-disordered breathing. This comprehensive approach offers valuable insights into the multifactorial nature of sleep disorders and highlights the interconnectedness of demographic, behavioral, and metabolic factors.
One notable limitation is the cross-sectional nature of the study, which limits establishing causality between diet quality and sleep-disordered breathing. Longitudinal studies are needed to understand the temporal relationships and causal pathways underlying these associations. In particular, the correlation between metabolic syndrome components, blood test results, and sleep apnea can present a reverse causality issue. For example, poor sleep quality can exacerbate metabolic components or blood test levels. To address this reverse causality problem, additional cohort studies or RCTs that can establish causality will be needed in the future.
Additionally, the reliance on self-reported data for dietary intake, lifestyle behaviors, and sleep quality may introduce measurement biases and potential inaccuracies. The subjective nature of self-reports could lead to misclassification and underestimation of certain factors, impacting the robustness of the findings. Furthermore, while the study adjusted for various confounding factors, the presence of unmeasured or residual confounders cannot be completely ruled out. These unaccounted variables may introduce biases and influence the observed associations between diet, lifestyle, metabolic health, and sleep quality. The generalizability of the findings may also be limited, as the study sample may not fully represent the broader population. Bias may arise from targeting a relatively healthy population visiting the health examination center. Moreover, this study thoroughly examined the connections between dietary patterns, lifestyle behaviors, metabolic factors, and sleep quality. However, further research is needed to explore the underlying mechanistic pathways of these interrelationships. Understanding the connections between diet, metabolism, and sleep disturbances is essential for a comprehensive understanding of their associations. Despite these limitations, the study’s findings contribute to the existing knowledge base and provide a foundation for future research endeavors aiming to unravel the intricacies of the relationship between diet, lifestyle, metabolic health, and sleep quality. Addressing these limitations through longitudinal, mechanistic studies and improved measurement methods will be essential for advancing our understanding and enhancing the clinical implications of the observed associations.
In conclusion, this study sheds light on the association between diet and sleep apnea, emphasizing the importance of further investigating the mechanical pathway underlying this association.
Supplementary material
Content of each question in the RFS questionnaire
Notes
AUTHOR CONTRIBUTIONS
Dr. Jong Seung KIM had full access to all of the data in the study and takes responsibility for the integrity of the data and the accuracy of the data analysis. All authors reviewed this manuscript and agreed to individual contributions.
Conceptualization: TP and JSK. Data curation: TP and JSK. Formal analysis: JSK. Methodology: TP and JSK. Software: JSK. Writing–original draft: JSL. Writing–review & editing: BO and SH.
CONFLICTS OF INTEREST
No existing or potential conflict of interest relevant to this article was reported.
FUNDING
None.
DATA AVAILABILITY
The data presented in this study are available upon reasonable request from the corresponding author.
Acknowledgements
We are grateful to all the study participants for their contributions.