Warning: mkdir(): Permission denied in /home/virtual/lib/view_data.php on line 81

Warning: fopen(upload/ip_log/ip_log_2024-11.txt): failed to open stream: No such file or directory in /home/virtual/lib/view_data.php on line 83

Warning: fwrite() expects parameter 1 to be resource, boolean given in /home/virtual/lib/view_data.php on line 84
Energy Expenditure on a User Sensitive Spontaneous Speed Control Treadmill

Energy Expenditure on a User Sensitive Spontaneous Speed Control Treadmill

Article information

Korean J Health Promot. 2015;15(1):1-8
Publication date (electronic) : 2015 December 19
doi : https://doi.org/10.15384/kjhp.2015.15.1.1
1Exercise Physiology Laboratory, Department of Physical Education, Kookmin University, Seoul, Korea
2MediPlus Solution, Seoul, Korea
Corresponding author:Bong-Yeon Hwang, PhD Department of Physical Education, Kookmin University, 77 Jeongneung-ro, Seongbuk-gu, Seoul 136-702, Korea Tel: +82-2-910-5183, Fax: +82-2-910-4789 E-mail: hbo77@kookmin.ac.kr
Received 2014 August 15; Accepted 2014 November 28.

Abstract

Background

A conventional treadmill provides manually controlled constant speed during exercise. A fast interactive automatic speed control treadmill (FAST), which is highly sensitive to the position of the user on the belt and spontaneously adjusts its speed accordingly, was evaluated in terms of energy expenditure (EE) during exercise.

Methods

A total of 43 subjects were recruited and assigned to one of three exercise intensity groups- low (LIG; 40-50% of VO2max), moderate (MIG; 55-65% of VO2max), and high (HIG; 70-80% of VO2max). During the first test (Test-1), each subject performed an exercise bout on the FAST while spontaneously changing their locomotion speed within their assigned range of intensity. The average speed in Test-1 was calculated and applied to the second test (Test-2), in which the subjects exercised at a constant belt speed and matched the total travel distance of Test-1. During the tests, the oxygen uptake (VO2), heart rate (HR), respiratory quotient (RQ), oxygen pulse (OP), and EE of each subject were measured.

Results

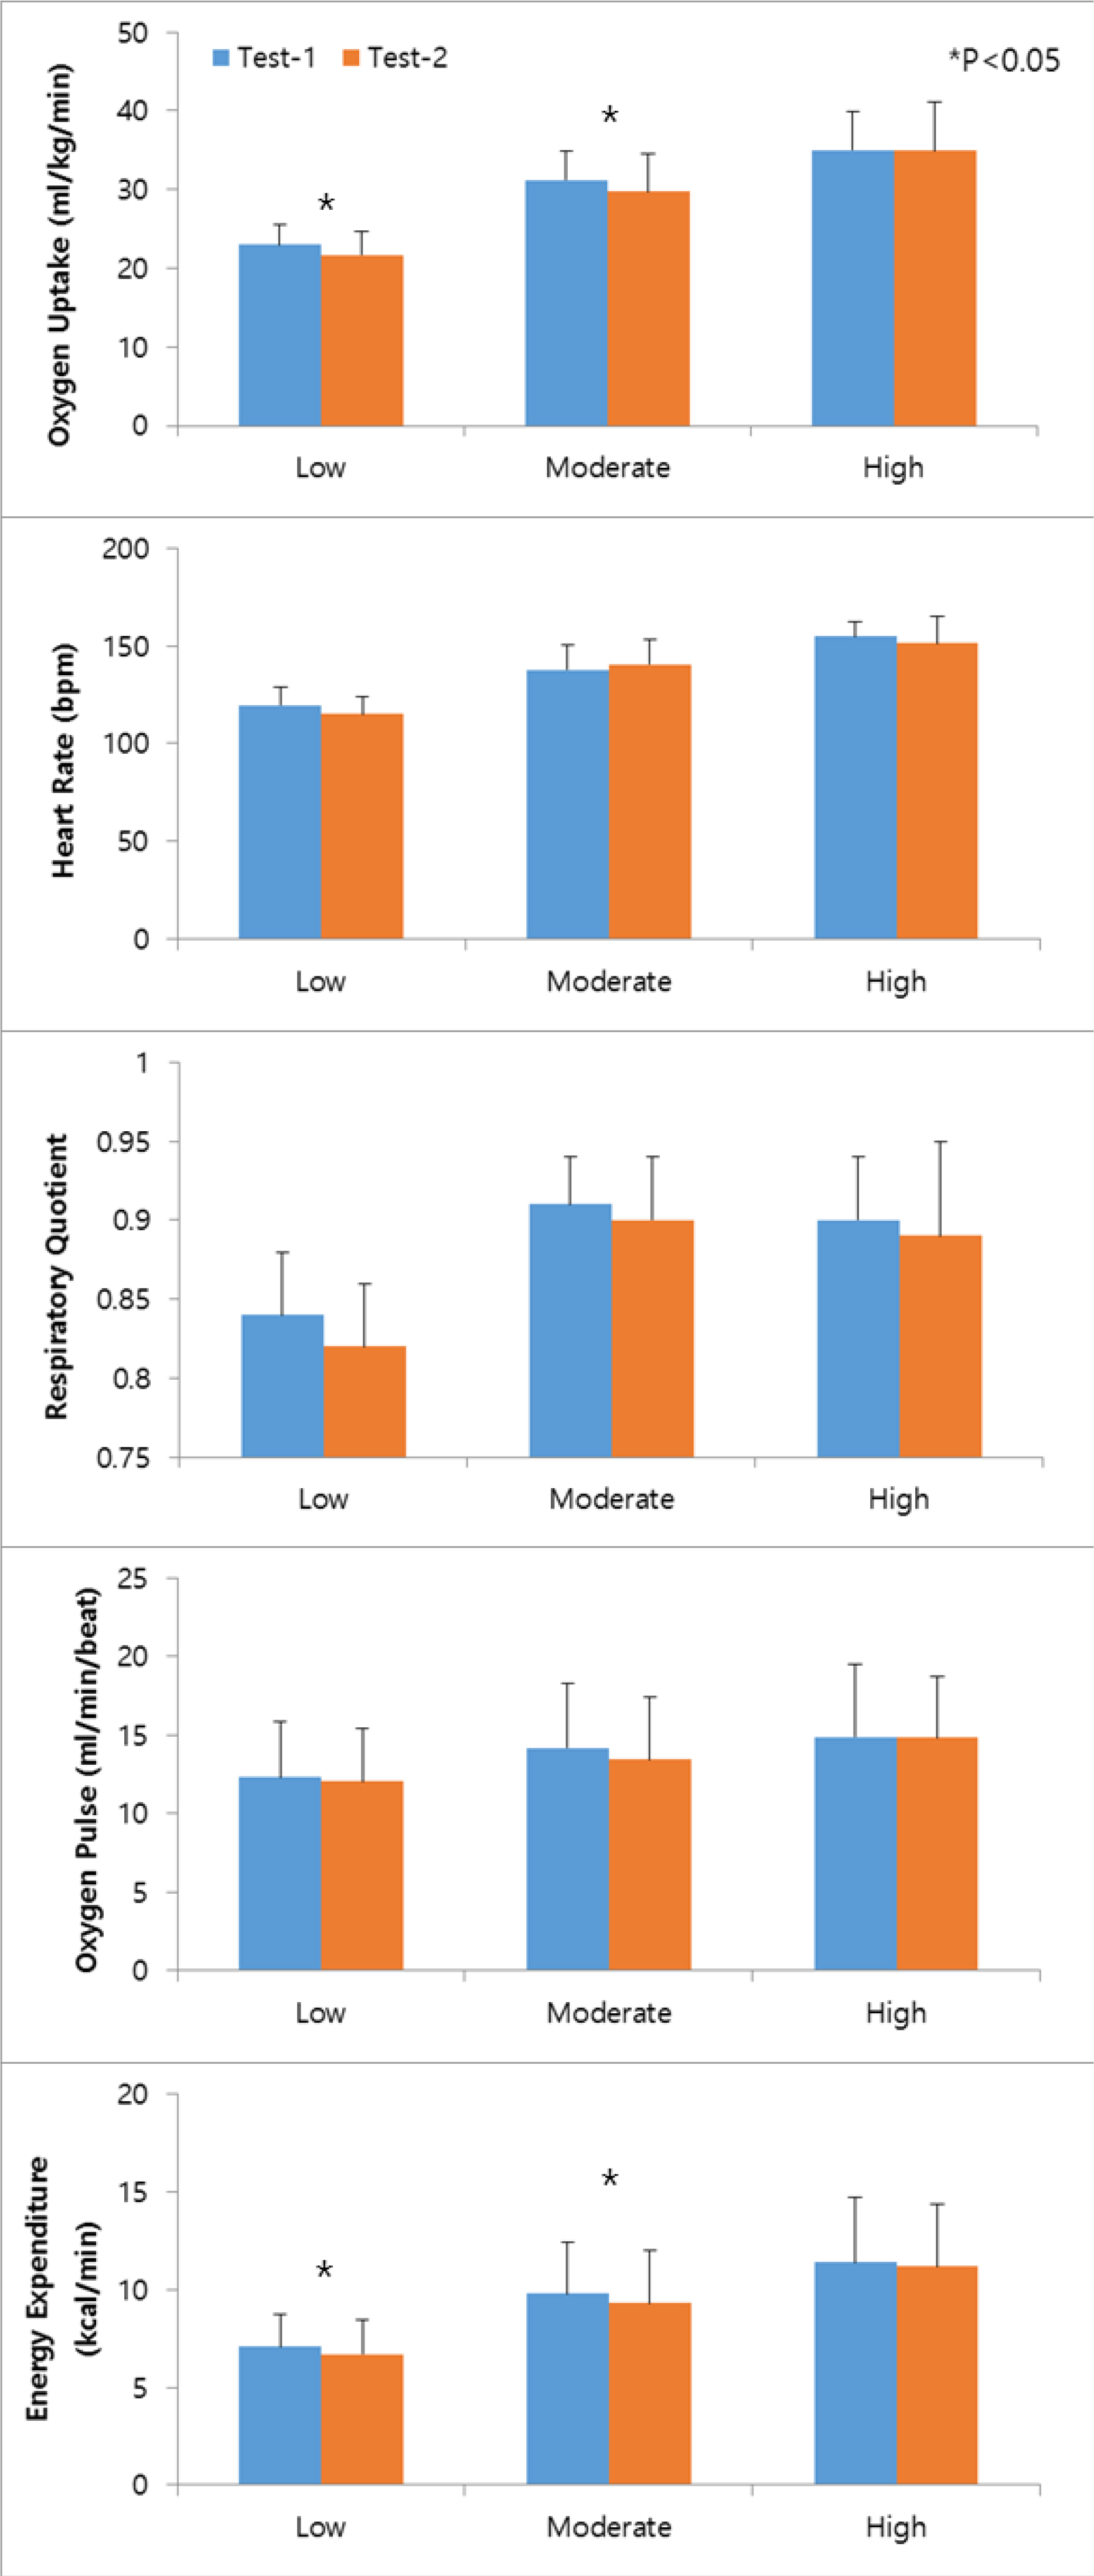
The average VO2 in Test-1 was higher than that in Test-2 for both the LIG (22.95±2.55 vs. 21.72±2.90 ml/kg/min) and MIG (31.17±3.75 vs. 29.73±4.86 mL/kg/min) (P<.05) subjects. The EE in Test-1 was higher than that in Test-2 for both the LIG (7.09±1.67 vs. 6.71±1.73 kcal/min) and MIG (9.79±2.62 vs. 9.32±2.71 kcal/min) (P<.05) subjects. The HR, RQ, and OP in the LIG and the MIG were similar. There was no difference between Test-1 and Test-2 in any of the metabolic parameters for the HIG subjects.

Conclusions

The results indicated that, low- to moderate-intensity treadmill exercise at varying speeds required higher energy expenditure than that at a constant speed. Thus, a treadmill with a spontaneous speed variation function may be an effective exercise modality that increases energy expenditure.

Figure 1.

Metabolic responses and energy expenditure of three exercise intensity groups by varying and constant treadmill speed.

Physical characteristics of subjectsa

Range of target oxygen consumption and average speed during testsa

References

1. Buchner HH, Savelberg HH, Schamhardt HC, Merkens HW, Barneveld A. Kinematics of treadmill versus overground locomotion in horses. Vet Q 1994;16(Suppl 2):S87–90.
2. Frishberg BA. An analysis of overground and treadmill sprinting. Med Sci Sports Exerc 1983;15(6):478–85.
3. Pierrynowski MR, Winter DA, Norman RW. Transfers of mechanical energy within the total body and mechanical efficiency during treadmill walking. Ergonomics 1980;23(2):147–56.
4. Savelberg HH, Vorstenbosch MA, Kamman EH, van de Weijer JG, Schambardt HC. Intra-stride belt-speed variation affects treadmill locomotion. Gait Posture 1998;7(1):26–34.
5. Alton F, Baldey L, Capian S, Morrissey MC. A kinematic comparison of overground and treadmill walking. Clin Biomech (Bristol Avon) 1998;13(6):434–40.
6. Stolze H, Kuhtz-Buschbech JP, Mondwurf C, Boczek-Funcke A, Jöhnk K, Deuschl G, et al. Gait analysis during treadmill and overground locomotion in children and adults. Electroencephalogr Clin Neurophysiol 1997;105(6):490–7.
7. Warabi T, Kato M, Kiriyama K, Yoshida T, Kobayashi N. Treadmill walking and overground walking of human subjects compared by recording sold-floor reaction force. Neurosci Res 2005;53(3):343–8.
8. Elliott BC, Blanksby BA. A cinematographic analysis of overground and treadmill running by males and females. Med Sci Sports 1976;8(2):84–7.
9. Riley PO, Dicharry J, Franz J, Della Croce U, Wilder RP, Kerrigan DC. A kinematics and kinetic comparison of overground and treadmill running. Med Sci Sports Exerc 2008;40(6):1093–100.
10. Greig C, Btler F, Skelton D, Mahmud S, Young A. Treadmill walking in old age may not reproduce the real life situation. J Am Geriatr Soc 1993;41(1):15–8.
11. Murray MP, Spurr GB, Sepic SB, Gardner GM, Mollinger LA. Treadmill vs. floor walking: kinematics, electromyogram, and heart rate. J Appl Physiol (1985) 1985;59(1):87–91.
12. Parvataneni K, Ploeg L, Olney SJ, Brouwer B. Kinematic, kinetic and metabolic parameters of treadmill versus overground walking in healthy older adults. Clin Biomech (Bristol, Avon) 2009;24(1):95–100.
13. Riley PO, Paolini G, Croce UD, Paylo KW, Kerrigan DC. A kinematic and kinetic comparison of overground and treadmill walking in healthy subjects. Gait Posture 2007;26(1):17–24.
14. Stoquart G, Detrembleur C, Lejeune T. Effect of speed on kinematic, kinetic, electromyographic and energetic reference values during treadmill walking. Neurophysiol Clin 2008;38(2):105–16.
15. Lee SJ, Hidler J. Biomechanics of overground versus treadmill walking in healthy individuals. J Appl Physiol (1985) 2008;104(3):747–55.
16. Arsenault AB, Winter DA, Marteniuk RG. Treadmill versus walkway locomotion in humans: an EMG study. Ergonomics 1986;29(5):665–76.
17. Minnetti AE, Ardigo LP, Capodaglio EM, Saibene F. Energetics and mechanics of human walking at oscillating speeds. Am Zool 2001;41(2):205–10.
18. van Ingen Schenau GJ. Some fundamental aspects of the biomechanics of overground versus treadmill locomotion. Med Sci Sports Exerc 1980;12(4):257–61.
19. Pearce ME, Cunningham DA, Donner AP, Rechnitzer PA, Fullerton GM, Howard JH. Energy cost of treadmill and floor walking at self-selected paces. Eur J Appl Physiol Occup Physiol 1983;52(1):115–9.
20. Minnetti AE, Boldrini L, Brusamolin L, Zamparo P, McKee T. A feedback-controlled treadmill (treadmill-on-demand) and the spontaneous speed of walking and running in humans. J Appl Physiol (1985) 2003;95(2):838–43.
21. Segers V, Lenoir M, Aerts P, De Clercq D. Influence of M. tibialis anterior fatigue on the walk-to-run and run-to-walk transition in non-steady state locomotion. Gait Posture 2007;25(4):639–47.
22. Kram R, Taylor CR. Energetics of running: a new perspective. Nature 1990;346(6281):265–7.
23. Taylor CR. Force development during sustained locomotion: a determinant of gait, speed and metabolic power. J Exp Biol 1985;115:253–62.
24. Biewener AA, Farley CT, Roberts TJ, Temaner M. Muscle mechanical advantage of human walking and running: implications for energy cost. J Appl Physiol (1985) 2004;97(6):2266–74.
25. Saibene F, Minetti AE. Biomechanical and physiological aspects of legged locomotion in humans. Eur J Appl Physiol 2003;88(4-5):297–316.
26. Nilsson J, Thorstensson A, Halbertsma J. Changes in leg movements and muscle activity with speed of locomotion and mode of progression in humans. Acta Physiol Scand 1985;123(4):457–75.
27. Andersson EA, Nilsson J, Thorstensson A. Intramuscular EMG from the hip flexor muscles during human locomotion. Acta Physiol Scand 1997;161(3):361–70.
28. Waters RL, Lunsford BR, Perry J, Byrd R. Energy-speed relationship of walking: standard tables. J Orthop Res 1988;6(2):215–22.
29. Waters RL, Mulroy S. The energy expenditure of normal and pathologic gait. Gait Posture 1999;9(3):207–31.
Article information Continued

Figure 1.

Metabolic responses and energy expenditure of three exercise intensity groups by varying and constant treadmill speed.

Table 1.

Physical characteristics of subjectsa

Variables Low-intensity group Moderate-intensity group High-intensity group Pb
Men Women Total Men Women Total Men Women Total
(n=7) (n=6) (n=13) (n=7) (n=7) (n=14) (n=8) (n=8) (n=16)
Age, y 26.7±6.8 23.2±3.7 25.1±5.6 23.9±4.1 21.4±2.6 22.6±3.5 26.0±4.6 23.1±3.8 24.6±4.3 0.340
Height, cm 173.4±4.3 162.0±3.7 168.1±7.1 174.8±4.8 163.1±3.6 169.0±7.3 176.0±3.4 164.2±4.3 170.1±7.2 0.757
Weight, kg 74.1±9.7 51.9±2.4 63.9±13.5 72.4±7.4 53.5±3.4 63.0±11.3 73.9±7.3 55.1±7.4 64.5±12.0 0.940
Body fat, % 18.5±7.4 21.9±3.7 20.1±6.0 14.2±4.0 23.7±3.7 19.0±6.2 16.2±4.2 23.8±3.1 20.0±5.3 0.931
BMI, kg/m2 24.7±3.4 19.8±0.9 22.4±3.6 23.7±1.9 20.1±1.1 21.9±2.4 23.8±2.0 20.4±2.0 22.1±2.6 0.881
Resting HR, beat/min 60.3±2.4 67.8±8.7 63.8±7.1 58.6±3.5 66.6±8.6 62.6±7.6 60.1±6.5 62.8±3.3 61.4±5.2 0.409
Maximal HR, beat/min 191.1±11.9 186.3±3.9 188.9±9.1 190.0±9.0 188.3±3.9 189.1±6.7 188.5±7.3 187.3±8.7 187.9±7.8 0.901
VO2max, mL/kg/min 51.7±7.9 47.7±4.3 49.8±6.6 57.8±2.8 46.1±4.7 51.9±7.1 54.4±4.4 44.3±2.9 49.3 ± 6.3 0.544

Abbreviations: BMI, body mass index; HR, heart rate; VO2max, maximal oxygen consumption.

a

Values are presented as mean±SD.

b

Total were analyzed by one way ANOVA.

Table 2.

Range of target oxygen consumption and average speed during testsa

Low-intensity group Moderate-intensity group High-intensity group
Man Woman Total Man Woman Total Man Woman Total
(n=7) (n=6) (n=13) (n=7) (n=7) (n=14) (n=8) (n=8) (n=16)
Range of target VO2, 20.7±3.2 19.1±1.7 19.9±2.6 31.8±1.5 25.4±2.6 28.6±3.9 38.1±3.1 31.0±2.0 34.5±4.4
mL/kg/min - 25.8±4.0 - 23.8±2.1 - - 24.9±3.3 - 37.6±1.8 - 30.0±3.1 - - 33.8±4.6 - 43.5±3.5 - - 35.4±2.3 - 39.5±5.1
Average speed, km/h 6.7±0.4 6.3±0.5 6.5±0.5 8.3±0.4 7.1±0.8 7.7±0.9 10.4±0.9 7.6±1.0 9.1±1.7
Speed(min. - max.) in 3.8±0.6 3.5±0.6 3.7±0.6 3.8±1.1 4.2±0.6 4.0±0.9 4.3±0.5 3.8±1.4 4.1±1.0
Test-1, km/h - 9.4±1.5 - 9.2±1.6 - 9.3±1.5 - 12.2±1.0 - - 10.3±1.5 - 11.3±1.5 - 14.4±1.3 - - 11.6±1.4 - 13.0±2.0

Abbreviation: VO2, oxygen uptake.

a

Values are presented as mean±SD.