Obesity and Obesity-Related Lifestyles of Korean Breast Cancer Survivors
Article information
Abstract
Abstract
Background
Obesity not only does increase the incidence of breast cancer, but also affects the course of treatment, recurrence and mortality. This study aims to evaluate on the obesity status of Korean breast cancer survivors and their obesity-related lifestyles.
Methods
The study included 125 Korean female breast cancer survivors aged over 19 year old enrolled in the 2009–11 Korean National Health and Nutrition Examination Survey. Women who answered ‘yes' to the question ‘have you ever been diagnosed breast cancer by a physician?' was defined as a breast cancer survivors. Height, weight, and waist circumference were measured and Body mass index (BMI) was calculated. Body fat percent was assessed by dual X-ray absorptiometry (DXA). Standardized surveys by trained interviewers were used to investigate survivors' obesity-related lifestyles such as physical activities, sleeping hours and nutrients intake.
Results
48.4% of Korean breast cancer survivors were obese. 44.7% had abdominal obesity and 89.2% had body fat percent over 30. Their physical activity level was generally low; only 22.5% maintained health-enhancing level of physical activities. Fat intake (14.4 [0.8] %) was as low and carbohydrate intake (74.2 [1.2] %) was high. However, daily dietary fiber intake was low (10.5 [1.1] g). Factors that were found to be significantly related with obesity in Korean breast cancer survivors were low education level (P=0.042), smoking (P<0.001), having chronic diseases (P=0.002) and short sleeping hours (P<0.001).
Conclusions
It is mandatory for physician to evaluate obesity status of breast cancer survivors as soon as their diagnosis and give proper intervention to maintain healthy weight and healthy obesity related lifestyle.
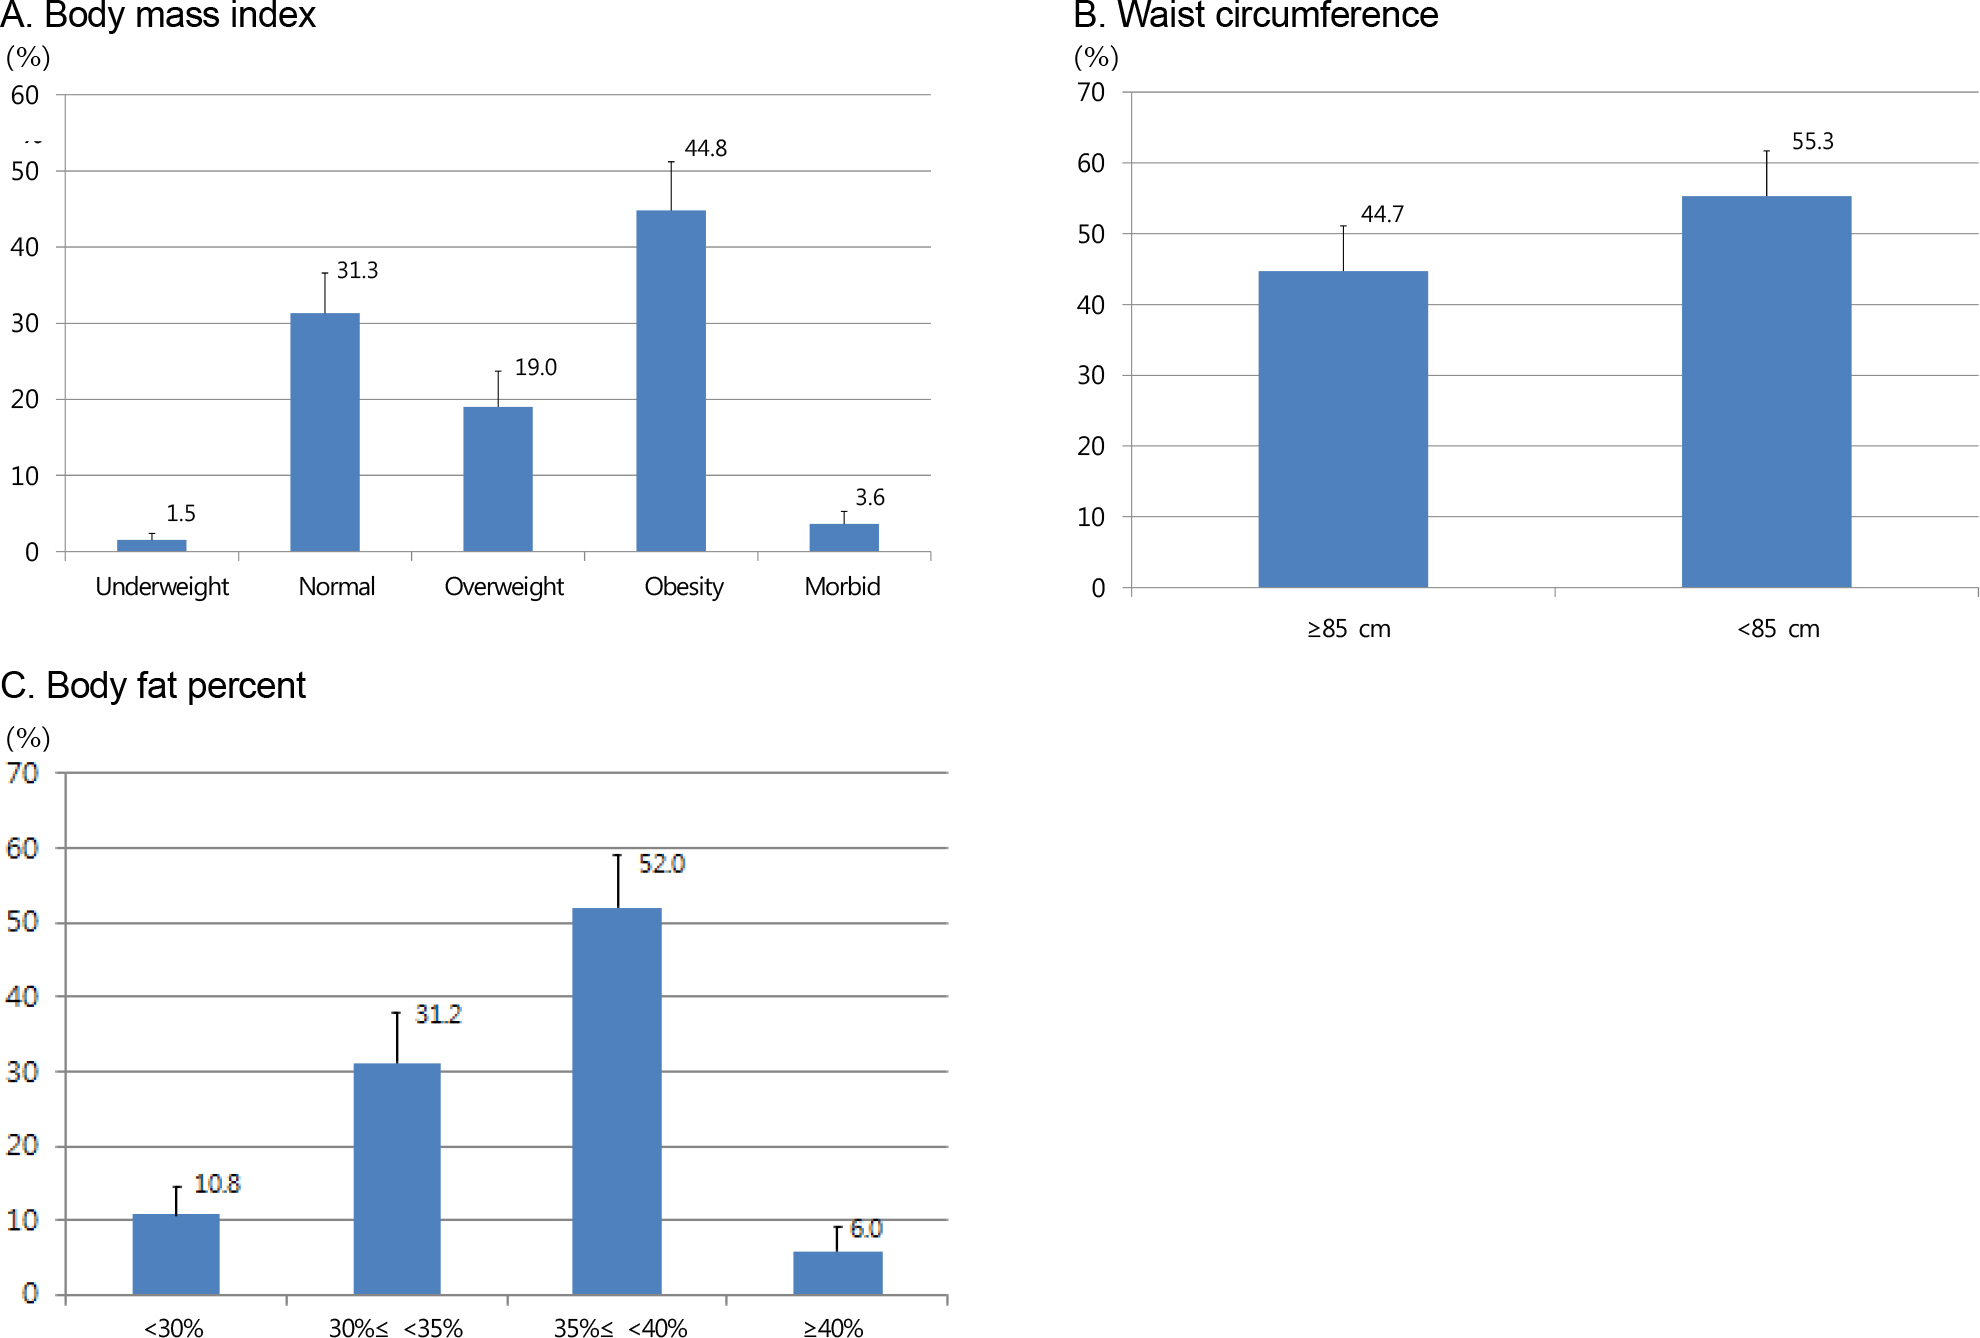
Obesity status of 125 Korean breast cancer survivors

Baseline characteristics of 125 Korean breast cancer survivors


Estimated effects on body mass index (kg/m2) of obesity related factors in Korean breast cancer survivors