

| Korean J Health Promot > Volume 14(3); 2014 > Article |

|
Tel: +82-2-2270-0097, Fax: +82-2-2272-0908 E-mail: drparkhyunah@gmail.com
Received June 27, 2014 ┬Ā ┬Ā ┬Ā Accepted August 20, 2014
Abstract
Background
Obesity not only does increase the incidence of breast cancer, but also affects the course of treatment, recurrence and mortality. This study aims to evaluate on the obesity status of Korean breast cancer survivors and their obesity-related lifestyles.
Methods
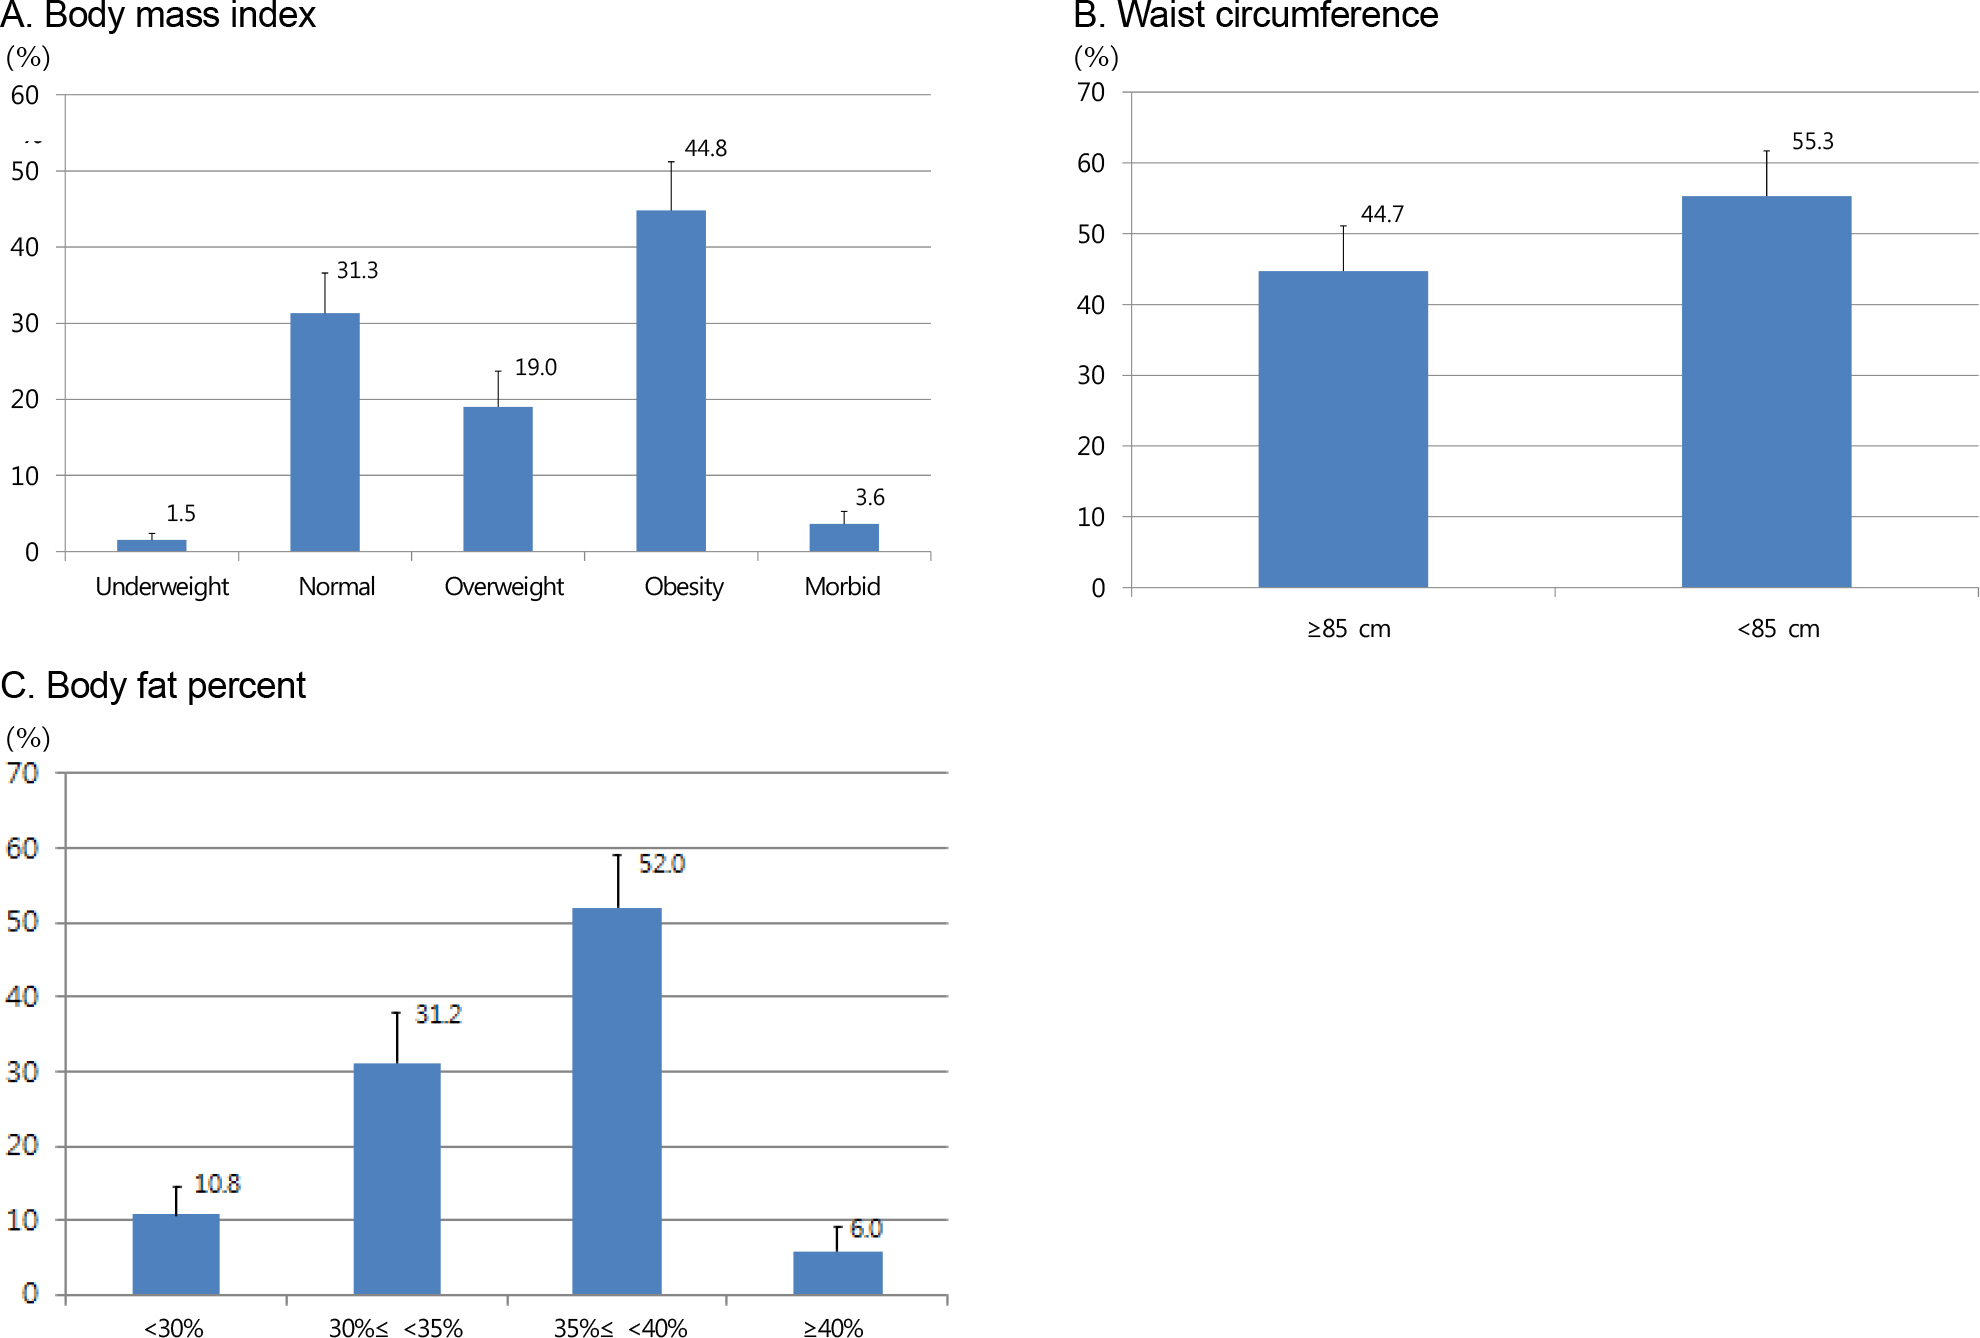
The study included 125 Korean female breast cancer survivors aged over 19 year old enrolled in the 2009ŌĆō11 Korean National Health and Nutrition Examination Survey. Women who answered ŌĆśyes' to the question ŌĆśhave you ever been diagnosed breast cancer by a physician?' was defined as a breast cancer survivors. Height, weight, and waist circumference were measured and Body mass index (BMI) was calculated. Body fat percent was assessed by dual X-ray absorptiometry (DXA). Standardized surveys by trained interviewers were used to investigate survivors' obesity-related lifestyles such as physical activities, sleeping hours and nutrients intake.
Results
48.4% of Korean breast cancer survivors were obese. 44.7% had abdominal obesity and 89.2% had body fat percent over 30. Their physical activity level was generally low; only 22.5% maintained health-enhancing level of physical activities. Fat intake (14.4 [0.8] %) was as low and carbohydrate intake (74.2 [1.2] %) was high. However, daily dietary fiber intake was low (10.5 [1.1] g). Factors that were found to be significantly related with obesity in Korean breast cancer survivors were low education level (P=0.042), smoking (P<0.001), having chronic diseases (P=0.002) and short sleeping hours (P<0.001).
Table┬Ā1.
Baseline characteristics of 125 Korean breast cancer survivors
| Characteristics | ŃĆĆ | Percentage (SE) | BMIa Mean (SE) | Pb |
|---|---|---|---|---|
| Age, y | Mean (SE) | 56.9 (1.3) | ┬Ā | ┬Ā |
| ┬Ā | Ōēż39 | 4.0 (3.2) | 25.01 (1.13) | 0.101 |
| ┬Ā | 40Ōēż, Ōēż64 | 63.8 (6.2) | 24.14 (0.36) | ┬Ā |
| ┬Ā | 65Ōēż | 32.2 (5.9) | 26.06 (0.83) | ┬Ā |
| Age at cancer diagnosis, y | Mean (SE) | 49.2 (1.4) | ┬Ā | ┬Ā |
| Time since diagnosis, y | Mean (SE) | 7.6 (0.8) | ┬Ā | ┬Ā |
| ┬Ā | Ōēż2 | 25.1 (6.0) | 24.44 (1.20) | 0.631 |
| ┬Ā | 3Ōēż, Ōēż5 | 25.4 (5.2) | 24.39 (0.46) | ┬Ā |
| ┬Ā | 6Ōēż, Ōēż10 | 19.5 (4.2) | 25.15 (1.00) | ┬Ā |
| ┬Ā | 10< | 30.0 (5.6) | 25.22 (0.52) | ┬Ā |
| Education | Middle school graduate or less | 51.9 (6.3) | 25.80 (0.58) | 0.012 |
| ┬Ā | High school graduate | 27.9 (5.5) | 23.70 (0.44) | ┬Ā |
| ┬Ā | College or graduate degree | 20.2 (5.4) | 23.72 (0.84) | ┬Ā |
| Household incomec | Low | 23.4 (4.6) | 25.46 (0.82) | 0.432 |
| ┬Ā | Middle low | 24.7 (5.0) | 23.95 (0.70) | ┬Ā |
| ┬Ā | Middle high | 23.2 (5.5) | 24.41 (0.40) | ┬Ā |
| ┬Ā | High | 28.7 (6.3) | 25.30 (0.95) | ┬Ā |
| Marital status | Married | 72.3 (6.1) | 24.53 (0.34) | 0.395 |
| ┬Ā | Single | 27.7 (6.1) | 25.49 (1.07) | ┬Ā |
| Employed | Yes | 31.5 (5.7) | 25.47 (0.67) | 0.244 |
| ┬Ā | No | 68.5 (5.7) | 24.49 (0.51) | ┬Ā |
| Smoking | Smoker | 2.2 (1.5) | 31.99 (1.99) | 0.001 |
| ┬Ā | Nonsmoker | 97.8 (1.5) | 24.63 (0.39) | ┬Ā |
| High risk drinkingd | Yes | 8.9 (2.7) | 24.18 (0.64) | 0.385 |
| ┬Ā | No | 91.1 (2.7) | 24.86 (0.42) | ┬Ā |
| No. of current comorbid medical conditionse | 0 | 36.3 (5.8) | 23.88 (0.41) | 0.001 |
| ┬Ā | 1 | 17.6 (4.4) | 24.04 (0.92) | ┬Ā |
| ┬Ā | 2 | 17.6 (4.9) | 24.60 (0.62) | ┬Ā |
| ┬Ā | 3 | 14.1 (3.8) | 24.80 (0.82) | ┬Ā |
| ┬Ā | 4 or more | 14.4 (5.5) | 28.28 (0.91) | ┬Ā |
| Functional limitation | Yes | 28.8 (5.1) | 24.83 (0.66) | 0.954 |
| ┬Ā | No | 71.2 (5.1) | 24.78 (0.49) | ┬Ā |
| Perceived health | Good | 25.0 (5.7) | 25.12 (0.72) | 0.839 |
| ┬Ā | Moderate | 36.2 (6.4) | 24.81 (0.79) | ┬Ā |
| ┬Ā | Bad | 38.8 (5.8) | 24.58 (0.54) | ┬Ā |
| Stress level | Little | 19.7 (5.3) | 24.46 (0.92) | 0.211 |
| ┬Ā | Moderate | 44.1 (6.1) | 24.20 (0.39) | ┬Ā |
| ┬Ā | High | 36.2 (6.1) | 25.70 (0.76) | ┬Ā |
| Menopausal status | Premenopause | 54.2 (6.2) | 25.21 (0.61) | 0.225 |
| ŃĆĆ | Postmenopause | 45.8 (6.2) | 24.31 (0.43) | ŃĆĆ |
Table┬Ā2.
Intensity of physical activity and sleep duration among Korean breast cancer survivors according to BMI tertilesa
| Intensity of physical activity | 1st tertile 17.17ŌĆō22.63 | 2nd tertile 22.64ŌĆō25.43 | 3rd tertile 25.55ŌĆō34.42 | Total | Pc |
|---|---|---|---|---|---|
| BMIb | BMIb | BMIb | |||
| Walking/light activity | ┬Ā | ┬Ā | ┬Ā | ┬Ā | ┬Ā |
| ŌĆāDuration, min | 72.3 (19.1) | 61.8 (10.8) | 87.1 (17.2) | 75.0 (9.7) | 0.452 |
| ŌĆāFrequency, wk | 4.0 (0.6) | 3.2 (0.4) | 4.3 (0.4) | 3.9 (0.3) | 0.147 |
| ŌĆāMET | 1,420.9 (462.0) | 804.2 (197.7) | 1,295.0 (261.1) | 1,172.3 (177.2) | 0.502 |
| Moderate activity | ┬Ā | ┬Ā | ┬Ā | ┬Ā | ┬Ā |
| ŌĆāDuration, min | 28.9 (7.9) | 59.0 (17.6) | 17.6 (8.2) | 33.9 (7.4) | 0.097 |
| ŌĆāFrequency, wk | 1.8 (0.6) | 1.2 (0.4) | 0.8 (0.4) | 1.2 (0.3) | 0.346 |
| ŌĆāMET | 442.1 (146.9) | 733.3 (354.7) | 247.8 (114.8) | 455.4 (133.0) | 0.314 |
| Vigorous activity | ┬Ā | ┬Ā | ┬Ā | ┬Ā | ┬Ā |
| ŌĆāDuration, min | 27.4 (9.3) | 29.3 (11.6) | 25.9 (11.1) | 27.4 (6.4) | 0.978 |
| ŌĆāFrequency, wk | 0.9 (0.0) | 1.1 (0.0) | 1.1 (0.0) | 0.9 (0.2) | <0.001 |
| ŌĆāMET | 471.3 (176.7) | 972.1 (504.7) | 1,030.8 (540.0) | 860.8 (279.9) | 0.432 |
| Total MET | 2,334.3 (484.4) | 2,509.6 (852.3) | 2,573.7 (768.8) | 2,488.5 (432.0) | 0.961 |
| Physical activity leveld | ┬Ā | ┬Ā | ┬Ā | ┬Ā | ┬Ā |
| ŌĆāInactive | 41.5 (9.7) | 41.8 (9.0) | 52.5 (11.2) | 46.1 (6.1) | 0.380 |
| ŌĆāMinimally active | 21.9 (6.9) | 41.6 (10.3) | 29.8 (9.1) | 31.4 (5.5) | ┬Ā |
| ŌĆāHealth enhancing physical activity | 36.5 (10.4) | 16.7 (6.5) | 17.7 (8.4) | 22.5 (5.1) | ┬Ā |
| Daily sleep durationd, h | ┬Ā | ┬Ā | ┬Ā | ┬Ā | ┬Ā |
| ŌĆāŌēż6 | 35.0 (9.2) | 49.3 (9.5) | 58.3 (10.5) | 49.1 (6.2) | 0.365 |
| ŌĆā6ŌĆō7 | 18.6 (8.0) | 19.8 (6.9) | 21.4 (7.1) | 20.1 (4.4) | ┬Ā |
| ŌĆā7ŌĆō8 | 30.5 (8.9) | 25.1 (9.4) | 18.5 (8.4) | 23.9 (5.2) | ┬Ā |
| ŌĆāŌēź8 | 15.9 (8.8) | 5.7 (4.6) | 1.9 (1.4) | 6.9 (3.0) | ┬Ā |
Table┬Ā3.
Nutrients intake among Korean breast cancer survivors according to BMI tertilesa
| Dietary intake | 1st tertile 17.17ŌĆō22.63 | 2nd tertile 22.64ŌĆō25.43 | 3rd tertile 25.55ŌĆō34.42 | Total | Pc |
|---|---|---|---|---|---|
| BMIb | BMIb | BMIb | |||
| Energy, kcal | 1,663.0 (116.3) | 1,831.0 (99.2) | 1,725.6 (113.5) | 1,742.4 (65.7) | <0.001 |
| Carbohydrate, g | 301.7 (17.5) | 339.5 (22.0) | 316.4 (22.8) | 319.8 (12.8) | 0.388 |
| ŌĆā% Energy from carbohydrate | 71.4 (1.5) | 73.2 (2.4) | 72.0 (2.0) | 72.3 (1.2) | 0.855 |
| Protein, g | 67.9 (1.0) | 63.4 (5.6) | 57.5 (4.0) | 62.2 (3.7) | 0.509 |
| ŌĆā% Energy from protein | 15.3 (1.2) | 13.4 (0.8) | 12.9 (1.5) | 13.7 (0.5) | 0.146 |
| Fat, g | 26.3 (2.9) | 28.7 (3.1) | 31.2 (4.0) | 29.1 (2.1) | 0.610 |
| ŌĆā% Energy from fat | 13.3 (0.8) | 13.4 (1.1) | 15.1 (1.6) | 14.0 (0.8) | 0.594 |
| Fiber, g | 10.1 (2.0) | 12.9 (2.5) | 8.9 (1.2) | 10.5 (1.1) | 0.326 |
| ŌĆāFiber density, g/1,000 kcal | 6.1 (1.2) | 7.2 (1.3) | 5.1 (0.5) | 6.0 (0.6) | 0.237 |
| Sodium, mg/day | 4,462.4 (687.0) | 5,447.4 (738.4) | 3,832.0 (409.8) | 4,518.4 (366.0) | 0.154 |
| ŌĆāSodium density, mg/1,000 kcal | 2,702.9 (254.9) | 3,014.1 (353.2) | 2,253.5 (221.4) | 2,617.9 (173.8) | 0.144 |
Table┬Ā4.
Estimated effects on body mass index (kg/m2) of obesity related factors in Korean breast cancer survivors
| Characteristics | OR | 95% CI | Pa |
|---|---|---|---|
| Age, y | ┬Ā | ┬Ā | ┬Ā |
| ŌĆā65Ōēż | Reference | ┬Ā | ┬Ā |
| ŌĆā40Ōēż, Ōēż64 | 0.33 | ŌĆō1.20ŌĆō1.85 | 0.674 |
| ŌĆāŌēż39 | 3.06 | ŌĆō0.98ŌĆō7.10 | 0.138 |
| Education | ┬Ā | ┬Ā | ┬Ā |
| ŌĆāCollege or graduate degree | Reference | ┬Ā | ┬Ā |
| ŌĆāHigh school graduate | 0.92 | ŌĆō0.65ŌĆō2.49 | 0.250 |
| ŌĆāMiddle school graduate or less | 1.76 | 0.06ŌĆō3.45 | 0.042 |
| Smoking | ┬Ā | ┬Ā | ┬Ā |
| ŌĆāNonsmoker | Reference | ┬Ā | ┬Ā |
| ŌĆāSmoker | 5.34 | 2.38ŌĆō8.30 | <0.001 |
| Exercise limitation | ┬Ā | ┬Ā | ┬Ā |
| ŌĆāNo | Reference | ┬Ā | ┬Ā |
| ŌĆāYes | 0 | ŌĆō1.41ŌĆō1.42 | 0.996 |
| No. of current comorbid medical conditions | ┬Ā | ┬Ā | ┬Ā |
| ŌĆā0 | Reference | ┬Ā | ┬Ā |
| ŌĆā1 | 1.07 | ŌĆō0.75ŌĆō2.88 | 0.249 |
| ŌĆā2 | 0.99 | ŌĆō0.51ŌĆō2.49 | 0.194 |
| ŌĆā3 | 0.92 | ŌĆō1.22ŌĆō3.05 | 0.401 |
| ŌĆā4 or more | 3.31 | 1.25ŌĆō5.37 | 0.002 |
| Physical activity level | ┬Ā | ┬Ā | ┬Ā |
| ŌĆāHealth enhancing physical activity | Reference | ┬Ā | ┬Ā |
| ŌĆāMinimally active | 1.03 | ŌĆō0.69ŌĆō2.75 | 0.240 |
| ŌĆāInactive | 1.39 | ŌĆō0.22ŌĆō3.01 | 0.091 |
| Daliy sleep duration, h | ┬Ā | ┬Ā | ┬Ā |
| ŌĆā>8 | Reference | ┬Ā | ┬Ā |
| ŌĆā7ŌĆō8 | 2.97 | 1.22ŌĆō4.73 | 0.001 |
| ŌĆā6ŌĆō7 | 2.37 | 0.77ŌĆō3.96 | 0.004 |
| ŌĆā<6 | 2.76 | 1.29ŌĆō4.22 | <0.001 |
| Energy intake per 1,000 kcal | 0.03 | 0.00ŌĆō0.00 | 0.948 |
aCalculated by multivariate logistic regression analysis adjusted for age (<39 y, 40ŌĆō64 y, and >65 y), highest education achieved (middle school graduate or less, high school graduate, and college or graduate degree), current smoking status (smoker, and nonsmoker), exercise limitation (yes, and no), number of current comorbid medical conditions (0, 1, 2, 3, and 4 or more), physical activity level (health enhancing physical activity, minimally active, and inactive), sleep duration (>8 h, 7ŌĆō8 h, 6ŌĆō7 h, and <6 h), energy intake per 1,000 kcal.
References
1. Statistics Korea [Internet]. Daejeon: Statistics Korea; 2014. [Accessed Sep. 24, 2014].. http://www.cancer.go.kr/mbs/can-cer/subview.jsp?id=cancer_040302000000.
2. The Korea Central Cancer Registry, National Cancer Center. Annual report of cancer statistics in Korea in 2011. Goyang-si:. Ministry of Health and Welfare; 2013. [Accessed Sep 19, 2014].. http://ncc.re.kr/manage/manage03_033_view.jsp?bbsnum=. 295&hSelSearch=&hTxtKeyword=¤t_page=1&cd=null..
3. Protani M, Coory M, Martin JH. Effect of obesity on survival of women with breast cancer: systematic review and metaanalysis. Breast Cancer Res Treat 2010;123(3):627-35.


4. Rock CL, Doyle C, Demark-Wahnefried W, Meyerhardt J, Courneya KS, Schwartz AL, et al. Nutrition and physical activity guidelines for cancer survivors. CA Cancer J Clin 2012;62(4):243-74.
5. Pierce JP, Natarajan L, Caan BJ, Parker BA, Greenberg ER, Flatt SW, et al. Influence of a diet very high in vegetables, fruit, and fiber and low in fat on prognosis following treatment for breast cancer: the women's healthy eating and living (WHEL) randomized trial. JAMA 2007;298(3):289-98.

6. Statistics Korea. National Health and Nutrition Survey 2009. Korea Health Statistics 2009: Korea National Health and Nutrition Examination Survey (KNHANES IV). Reston: Ministry of Health and Welfare; 2009. [Accessed Sep. 19, 2014].. https://knhanes.cdc.go.kr/knhanes/index.do.
7. Deurenberg P, Deurenberg-Yap M, Guricci S. Asians are different from Caucasians and from each other in their body mass in-dex/body fat per cent relationship. Obes Rev 2002;3(3):141-6.
8. Oh JY, Yang YJ, Kim BS, Kang JH. Validity and reliability of Korean version of international physical activity questionnaire (IPAQ) short form. J Korean Acad Fam Med 2007;28(7):532-41.
9. Chlebowski RT, Aiello E, McTiernan A. Weight loss in breast cancer patient management. J Clin Oncol 2002;20(4):1128-43.
10. Courneya K, Karvinen K, Vallance JK. Exercise motivation and behavior change. In: Feuerstein M, editor. Handbook of Cancer Survivorship. New York: Springer Science-Business Media LLC; 2006. p. 113-32.
11. Pinto BM, Ciccolo JT. Physical activity motivation and cancer survivorship. Recent Results Cancer Res 2011;186:367-87.
12. Schmitz KH, Courneya KS, Matthews C, Demark-Wahnefried W, Galv├Żo DA, Pinto BM, et al. American college of sports medicine roundtable on exercise guidelines for cancer survivors. Med Sci Sports Exerc 2010;42(7):1409-26.
13. Bae YJ. Evaluation of nutrient and food intake status, and dietary quality in Korean female adults according to obesity: based on 2007ŌĆō2009 Korean National Health and Nutrition Examination Survey. Korean J Nutr 2012;45(2):140-9.
14. Kang JH, Kim KA, Han JS. Korean diet and obesity. J Korean Soc Study Obes 2004;13(1):34-41.
15. Mosher CE, Sloane R, Morey MC, Snyder DC, Cohen HJ, Miller PE, et al. Associations between lifestyle factors and quality of life among older longterm breast, prostate, and colorectal cancer survivors. Cancer 2009;115(17):4001-9.
16. Zhang Q, Wang Y. Trends in the association between obesity and socioeconomic status in U.S. adults: 1971 to 2000. Obes Res 2004;12(10):1622-32.
17. Lantz PM, House JS, Lepkowski JM, Williams DR, Mero RP, Chen J. Socioeconomic factors, health behaviors, and mortality: results from a nationally representative prospective study of US adults. JAMA 1998;279(21):1703-8.
18. Lampert T. Smoking, physical inactivity, and obesity: associations with social status. Dtsch Arztebl Int 2010;107(1ŌĆō2):1-7.
19. Na YM, Park HA, Kang JH, Cho YG, Kim KW, Hur YI, et al. Obesity, obesity related disease, and disability. Korean J Fam Med 2011;32(7):412-22.
20. Schwartz MW, Woods SC, Porte D, Seeley RJ, Baskin DG. Central nervous system control of food intake. Nature 2000;404(6778):661-71.
21. Flier JS, Maratos-Flier E. The stomach speaks-ghrelin and weight regulation. N Engl J Med 2002;346(21):1662-3.
22. Park YR, Cho YG, Kang JH, Park HA, Kim KW, Hur YI, et al. Comparison of obesity and overweight prevalence among Korean adults according to community health survey and Korea national health and nutrition examination survey. Korean J Obes 2014;23(1):64-8.
23. Kim KN, Joo NS. Relationship between exercise, body fatness and metabolic syndrome. Korean J Obes 2009;18(4):138-45.
 PDF Links
 PubReader
 ePub Link
 Full text via DOI
 Download Citation
 Print
Print


-
METRICS

-
- 15 Crossref
- 0 Scopus
- 1,948 View
- 4 Download
- Related articles
-
Quality of Life and Associated Factor among Cancer Survivors in Korea2018 March;18(1)
- Editorial Office
-
Department of Family Medicine, Asan Medical Center, 88, Olympic-ro 43-gil, Songpa-gu, Seoul 05505, Korea
Tel: +82-2-3010-3820 Fax: +82-2-3010-3815 E-mail: kshpdp@amc.seoul.kr
Copyright © 2026 by Korean Society For Health Promotion And Disease Prevention.
