12년 이상의 기간 동안 우울 궤적과 한국 노인 사망률과의 연관성
Trajectories of Depression and Their Associations with Mortality in Older People in Korea over 12 Years
Article information

Abstract
연구배경
일생 동안 우울증 및 우울증상의 경과가 개인마다 다르기 때문에 본 연구는 한국 고령화연구패널조사를 바탕으로 궤적모델을 사용하여 12년의 추적 관찰 기간 동안 우울증상을 반복 측정함으로써 우울증상과 사망률의 연관성을 밝히고자 하였다.
방법
본 연구는 65세 이상의 노인 3,561명(남자 1,483명, 여자 2,078명)을 대상으로 하였다. 각 차수별로 역학연구를 위한 우울척도-단축형(10-item Center for EpidemiologicalStudies Depression Scale)을 사용하여 남성과 여성에서 서로 다른 우울증상 그룹을 분류하기 위한 궤적모델을 도출하였고, 우울증상 궤적과 모든 원인 사망률의 연관성을 조사하기 위해 콕스 비례 위험모델이 사용되었다.
결과
우울증상 궤적은 남녀 각각 ‘낮은 점수 지속형(LT)’, ‘보통 높은 점수형(MHT)’, ‘높은 점수 증가형(HIT)’ 및 ‘높은 점수 감소형(HDT)’의 4가지 유형으로 분류되었다. 남성에서 ‘낮은 점수 지속형(LT)’과 비교하여 ‘높은 점수 증가형(HIT)’, ‘높은 점수 감소형(HDT)’ 및 ‘보통 중간 점수형(MHT)’의 조정된 위험비율은 각각 2.12 (95% 신뢰구간, 1.43-3.16), 1.52 (95% 신뢰구간, 0.96-2.40), 1.58 (95% 신뢰구간, 1.10-2.26)로 나타났다. 여성의 경우 각각 1.62 (95%신뢰구간, 1.25-2.10), 0.84 (95% 신뢰구간, 0.61-1.16) 및 1.20(95% 신뢰구간, 0.99-1.46)으로 나타났다.
결론
한국 노인인구에서 12년 동안 증가하는 심한 우울증상은 가장 높은 사망 위험과 관련이 있었다. 우울증상이 완화되는 궤적 그룹(HDT)의 경우 ‘높은 점수 증가형(HIT)’과 비슷한 초기 우울 강도를 보였음에도 불구하고 남성과 여성 모두에서 사망 위험이 낮았다
Trans Abstract
Background
As the course of depression and depressive symptoms over a lifetime varies between individuals, we used trajectory models based on the Korean Longitudinal Study of Aging to repeatedly measure symptoms over a follow-up period of 12 years to reveal the association with mortality.
Methods
Three thousand five hundred sixty-one (1,483 men and 2,078 women) subjects aged over 65 years were included. Using the 10-item Center for Epidemiological Studies Depression Scale (CES-D 10), a trajectory model was classified into different depressive symptom groups by gender. Cox proportional hazards models were used to investigate the association between depression trajectory and all-cause mortality.
Results
We identified four trajectories of depressive symptoms in both men and women characterized by low CES-D 10 scores throughout the study: Low trajectory (LT), Moderate high trajectory (MHT), High, but increasing trajectory (HIT), and High, but decreasing trajectory (HDT). The adjusted hazard ratios of the HIT, HDT, and MHT compared with LT in men were 2.12 (95% confidence interval [CI], 1.43-3.16), 1.52 (95% CI, 0.96-2.40), and 1.58 (95% CI, 1.10-2.26), respectively. In women, ratios of each group were 1.62 (95% CI, 1.25-2.10), 0.84 (95% CI, 0.61-1.16), and 1.20 (95% CI, 0.99-1.46).
Conclusions
Highly depressive symptoms that increased over the 12 years period were associated with the highest risk of mortality in the Korean elderly population. The trajectory group with remitting depressive symptoms(HDT), despite having a similar baseline level of mood symptoms as the high increasing group (HIT) experienceda lower mortality risk in both men and women.
INTRODUCTION
The association of depression with mortality among the general population has been well established in the literature [1]. The evidence for such an association in the elderly population, however, remains inconclusive, especially in well-controlled studies [2].
Rather than evaluating the presence or absence of depression in the elderly, it may be more efficient to examine depressive symptoms as older adults tend to have less obvious symptoms and are less willing to express their feelings, leading to a lower likelihood of a physician’s diagnosis [3].
The course of depression and depressive symptoms over a lifetime varies among individuals [4]. Some people show clinically relevant depressive symptoms only transiently, followed by full remission. Some have remitting and relapsing depression, while others are chronically depressed. Most previous studies have been limited by cross-sectional measures of depressive symptoms at a specific time point or by prospective studies using baseline measures of depressive symptoms [5,6]. Studies assessing depressive symptoms at several time points are scarce but demonstration of repeated measures of depression [7] can be useful to disentangle the complex association between depression and mortality [8].
To overcome these limitations, trajectory analysis has been proposed to identify the source of heterogeneity within a study population. Subjects with a similar degree of depression are assigned to groups based on their initial symptoms and changes over time [9].
Therefore, we used repeated measures of depressive symptoms in a prospective study of a national-wide cohort of Korean older adults. Previous studies with prospectively described depressive trajectories suggest that depressive symptoms persist or increase and may follow different trajectories in men and women [9-12].
In the present study, we aimed to examine the association of trajectories of depressive symptoms over a follow-up period of up to 12 years and mortality in Korean older men and women using the Korean Longitudinal Study of Aging(KLoSA).
METHODS
1. Data and study sample
Data for this study was obtained from KLoSA, an ongoing longitudinal panel survey of community-dwelling elderly persons in Korea. The initial KLoSA survey was launched in 2006, in which information was collected on 10,254 participants from 6,171 households aged ≥45 years at baseline. It was implemented with biennial follow-ups, and the seventh wave had been completed by 2018. By the 7th follow-up survey, the existing panel showed a stable trend of 77.6%, with a total of 6,136 valid samples available for analysis.
This survey includes questionnaires that consist of demographics, family history, health, depression, deaths, etc. Survey of the deceased was conducted by interviewing their family members about pre-death situations. The participants of the KLoSA were selected through multistage stratified probability sampling based on geographical areas. Face-to-face interviews were conducted by trained interviewers using the Computer-Assisted Personal Interviewing methods for all interviewees. All processes were informed and signed agreements from each participant were collected accordingly, while the study was approved by the Institutional Review Board of Statistics, Korea (No. WMCSB 202006-43).
Among the initial 10,254 participants of the KLoSA in 2006, 6,090 participants were excluded due to age (<65 years), along with those who had been diagnosed with stroke (n=34). Participants who measured the 10-item Center for Epidemiological Studies Depression Scale (CES-D 10) only once during follow-up (n=1,293) were also excluded. To investigate the association between depressive symptoms and all-cause mortality among these individuals, we finally included 3,561 (1,483 men and 2,078 women) study subjects at baseline.
2. Measurements
To evaluate depressive symptoms of the subject, CES-D 10 was used in the present study. The CES-D 10, a commonly used assessment tool for evaluating depressive conditions in the elderly population, was proved to be highly correlated with the original 20-item version [13]. The subjects responded to each item of questions in regards to the presence of symptoms during the past week. A one-point scale was adopted for each question. The possible range of the 10-item was 0 to 10. The score of CES-D 10 was divided into four trajectory subgroups of both men and women.
Sociodemographic factors included age, educational level, marital status, and family income. The level of education was classified into four categories: elementary school or less, middle school, high school, and university or above. Marital status was grouped into living with and not living with a spouse. Not living with a spouse was comprised of divorce, bereavement, and separation for a variety of reasons such as long-term accommodation and long stays abroad. Family income was classified based on the annual household income as less than 2,000 (thousand Korean Won), 2,000 to 10,000 (thousand Korean Won), 10,000 to 25,000 (thousand Korean Won), and more than 25,000 (thousand Korean Won).
Health behavioral confounders included smoking status, alcohol consumption, and whether exercise was performed regularly at least once a week (yes or no). Smoking status was divided into groups of non-smokers, former smokers, and current smokers. Former smokers were defined as those who were not smoking at present but had consumed more than five packs (100 cigarettes) in total. Drinkers were classified according to alcohol consumption as non-drinkers and current drinkers. Subjects who drink sometimes or frequently or drank recently were classified as “current drinkers”, with others classified as “non-drinkers”.
Health status was assessed by chronic disease status, self-rated health, and functional status. Subjects with chronic diseases were evaluated for the presence of hypertension, diabetes mellitus (DM), cancer, chronic lung disease, chronic liver disease, and heart disease. Self-rated health was classified into five categories (very good, good, normal, poor, and very bad) as described in the Survey of Health, Aging and Retirement in Europe (SHARE) study, which was subsequently reclassified into three categories (good, moderate, and bad) in the present study.
The physical functional status of the subjects was measured by the seven-item Korean Activities of Daily Living Scale (K-ADL), which assesses a person’s ability to perform activities of daily living without assistance [14]. ADL functioning was assessed through the use of seven questions asking the subject whether a person requires assistance to perform activities including dressing, washing/brushing, bathing/showering, eating, leaving the room, using the toilet, and controlling stool. In the ADL index, the questionnaire assigned a value of “1” for subjects requiring partial or full assistance with the activity or “0” if they did not require any assistance, and all values were summed.
Handgrip strength was also measured as part of the physical function assessment. The grip strength of both hands was measured twice using a handgrip dynamometer (TANITA
Hand Grip Meter Blue 6103; Tanita Co., Tokyo, Japan), and the average was collected for the study.
Body mass index (BMI) was also calculated for the physical function measurement. It was computed as weight in kilograms divided by height in squared meters (kg/m2).
Cognitive function was assessed using the Korean version of the Mini-Mental State Examination, which is frequently implemented to detect the cognitive impairment of older adults in Korea [15].
3. Statistical analysis
Since depression and mortality are known to differ between men and women, we analyzed the baseline characteristics of the participants separately by gender. The baseline characteristics of the study participants were analyzed by chi-square test for categorical variables and by one-way analysis of variance for continuous variables. Values are presented in percentages or means±standard deviation (SD).
The Trajectories were defined with group-based modeling that had been designed to classify a population into subgroups based on the CES-D score. Group-based trajectory modeling was selected using the Traj command of the STATA procedure. With this method, we could identify homogeneous clusters of developmental trajectories within a sample population over time. The two-stage model selection process as suggested by Nagin [16] was conducted in stages. We determined the number of trajectory groups and the best polynomial trajectory function in the first stage, and the Bayesian Information Criteria (BIC) value was calculated in the second stage [17] To evaluate trajectory model fit, we used the average group posterior probability.
The Cox proportional hazard model was utilized to investigate the association between patterns for CES-D 10 score and all-cause mortality. We constructed two Cox proportional hazard regression models to adjust for various confounding factors. Model 1 was adjusted for age, BMI, chronic diseases (hypertension, DM, cancer, chronic lung disease, chronic liver disease, heart disease), and self-rated health. Model 2 was adjusted from model 1 covariates plus the level of education, marital state, smoking, alcohol, family income, regular exercise, ADL, MMSE, and hand grip strength (HGS). The results were expressed as hazard ratio (HR) with 95% confidence interval (CI). All data were analyzed with STATA (Stata/MP 13.1 for Windows; StataCorp LP, Lakeway, TX, USA). A P-value of <0.05 was considered statistically significant.
RESULTS
1. Trajectory model development
This study analyzed four trajectory groups for men and women according to the score of CES-D 10. The number of trajectories was determined from the lowest absolute BIC value as the best-fitting one and the presence of a minimum of 5% participants per trajectory [18]. The 5-group model had the lowest BIC value, but had a small sample size for each group (less than 5%). The BIC value for this model was -22590.95 in men and the best fit among all the other 4-group models (Supplementary Table 1). In women, the lowest absolute BIC value was -33900.39 (Supplementary Table 1). The model fit was evaluated through multiple diagnostics as guided by Nagin [16] and along with the other criteria such as reasonable sample size for each group membership (e.g., group size is reasonably large, >5%), four trajectory groups were identified as a result: the low trajectory (LT), the moderate high trajectory (MHT), the high, but decreasing trajectory (HDT), and high, but increasing trajectory (HIT) group.
The lowest average posterior probability was 0.75 in men and 0.71 in women, which is greater than the recommended value of 0.7. This indicates that the model assigned subjects to different trajectory groups with little ambiguity.
2. Demographic and comorbidity characteristics of trajectory groups
We identified four trajectories of depressive symptoms in both men and women characterized by maintaining a low CES-D 10 score throughout the study (LT: 138 [11.8%] in men; 866 [39.5%] in women), moderately high scores that steadily increased (MHT: 985 [60.1%] in men; 745 [34.8%] in women), high starting scores that steadily increased (HIT: 227 [17.4%] in men; 221 [12.3%] in women) and high starting scores but then decreasing throughout (HDT: 133 [10.8%] in men; 246 [13.4%] in women).
Characteristics of men and women by trajectories of depressive symptoms are presented in Tables 1, 2. Participants in the less depressed group (LT), tended to exercise more regularly, and their socioeconomic state was higher (P<0.001). Physical function was better than the other groups, the percentage of good self-rated health was higher (P<0.001), ADL score was lower (P<0.001), HGS was higher (P<0.001), and baseline cognitive function was more preserved (P<0.001).

Characteristics of male participants according to depressive symptoms trajectory

Characteristics of female participants according to depressive symptoms trajectory
LT in men was more likely to live with a spouse (P<0.001), but this tendency was not observed in women. The percentage of chronic diseases was lower in the LT in women (DM, heart disease, caner), but only DM was lower in the LT in men. LT in women was more educated (P<0.001), and the smoking rate was lower (P<0.001).
Figure 1 shows the change in CES-D 10 of participants during the study period. The HDT in both men and women(Figure 1) had the highest starting score but then decreased over time, whereas the other groups showed gradual increase (MHT, HIT, LT in men) or maintained (LT in women) scores throughout follow up.
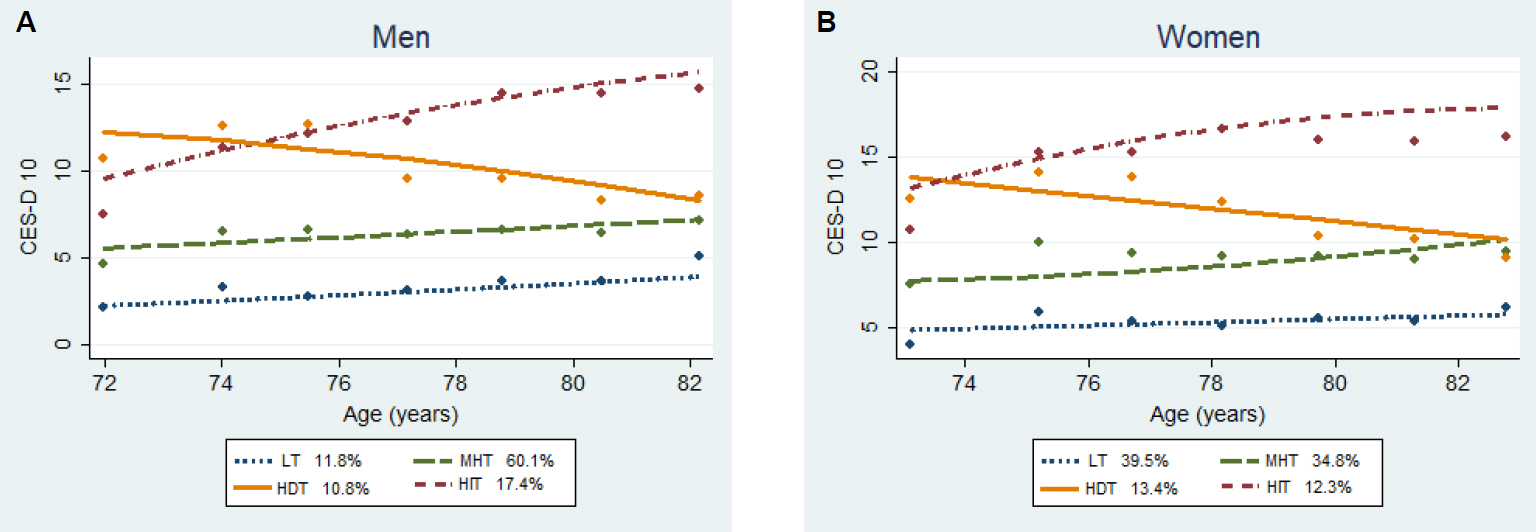
Depressive symptoms trajectories of the participants during study period (A) for men and (B) for women. CES-D 10 score decreased with age in the HDT group in both men (A) and women (B), while it increased in the other groups. Markers represent mean age at study visit. CES-D 10, the 10-item Center for Epidemiological Studies Depression Scale; LT, low trajectory; MHT, moderate high trajectory; HDT, high, but decreasing trajectory; HIT, high, but increasing trajectory.
3. Cox proportional HR of all-cause mortality according to CES-D 10 trajectories in participants
Tables 3, 4 show the association between depressive symptom trajectories and the Cox proportional HR of all-cause mortality in men and women, and the participants were adjusted for confounding variables (age, comorbidities, self-rated health, level of education, marital status, family income, smoking, alcohol, regular exercise, BMI, ADL, HGS, and MMSE). Compared with the LT, the MHT and HIT were associated with an increased mortality risk in men (Table 3), and HIT were associated in women (Table 4). The crude HRs of the MHT and HIT in men were 1.74 (95% CI, 1.22-2.48) and 2.83 (95% CI, 1.93-4.16) respectively, while adjusted HRs were 1.58 (95% CI, 1.10-2.26) and 2.12 (95% CI, 1.43-3.16) compared with the LT. In women, the crude HRs of the HIT compared with those of the LT was 2.02 (95% CI, 1.59-2.55) and the adjusted ratio was 1.62 (95% CI, 1.25-2.10). Among the confounding variables analyzed in model 2, the variables associated with mortality were age, DM, and smoking in both men and women. Figure 2 presents the Kaplan-Meier survival curves for these four groupings of depressive symptoms.

Cox proportional hazard ratio according to depressive symptoms trajectories in men

Cox proportional hazard ratio according to depressive symptoms trajectories in women
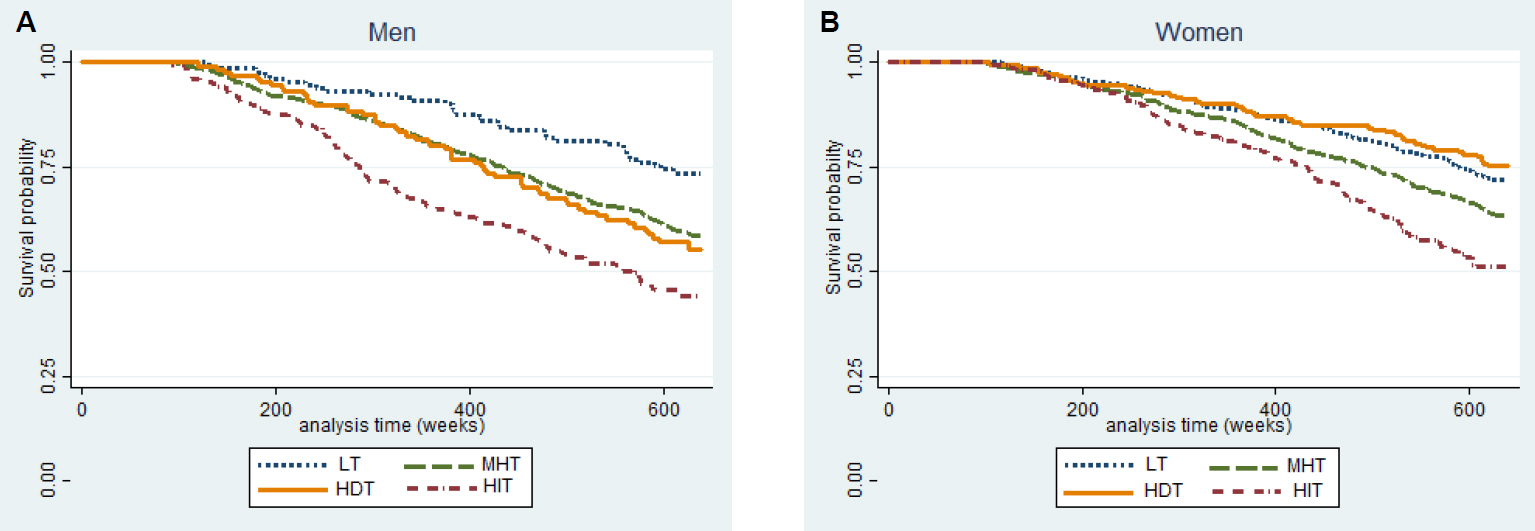
Kaplan-Meier survival curves of cumulative incidence of mortality in men (A) and women (B) by depressive symptoms trajectories. Y-axis represents probability of survival (A, B). LT, low trajectory; MHT, moderate high trajectory; HDT, high, but decreasing trajectory; HIT, high, but increasing trajectory
DISCUSSION
In this nationwide community-based cohort followed up over 12 years, trajectory analyses revealed four trajectories in the course of depressive symptoms in both Korean men and women over 65 years of age. Throughout the study period, three trajectories (low, moderate high, high increasing trajectory) showed steadily increasing depressive symptom scores, while one trajectory (high decreasing trajectory) with a relatively high starting score showed steady decrease over time in both men and women. These trajectories may reflect the natural history of depressive symptoms in the community.
After adjusting for confounding variables, compared with the LT, the MHT and HIT were associated with an increased mortality risk in men, and HIT were associated in women. The mortality risk of HDT was lower than HIT in both men and women. The HRs (95% CIs) in men were 1.52 (0.96-2.40) and 2.12 (1.43-3.16) for HDT and HIT and in women were 0.84 (0.61-1.16) and 1.62 (1.25-2.10), respectively. In women, although it was not statistically significant, the risk of mortality in HDT showed slightly lower than that of the LT (adjusted HR, 0.84; 95% CI, 0.61-1.16). This means that the group with remitting depressive symptoms had a lower mortality risk compared to the persistently depressive group despite having similar baseline symptom scores and had a similar risk with the non-depressive group at baseline.
Previous studies had mixed results about depressive symptoms and mortality. Earlier studies examining this relationship have used varying measures of depressive symptoms and varying lengths of follow-up in a variety of population types and sizes [19]. Some of these studies found that depression significantly predicted mortality [2,20]. In another study, the lack of independent association between depression and 6-month mortality was attributed to the short duration of follow-up [21].
Several prospective studies measured depressive symptoms repeatedly and used trajectory models. They have varied study periods from 4 years [3] to 11 years [22]. All the trajectory groups with steadily increasing depressive symptoms were in the short term study period,3) and some groups with remission of depressive symptoms were only in the long-term period [8,9,22]. Murphy et al. [3] made subgroup analysis by gender, while others did not classify the group by gender and only adjusted gender during analysis [8,9,22].
Murphy et al. [3] identified three depressive trajectory groups using CES-D scores in a 4-year study on adults aged 70 to 79 years. All three trajectory groups showed persistent depressive symptoms and the highest symptom score group had a higher mortality risk. This study differs from trajectory models of other studies with a longer period of depressive symptom measurements including trajectory groups with remission in symptoms. Although follow up was tracked for 14 years, depressive symptoms were measured only for the initial 4 years. Andreescu et al. [22] found six trajectory depressive groups among 1,260 community-based adults over 65 years in the USA. But they did not show model fitness with BIC and adjusted for only age, sex, and number of prescription medications.
Because depressive symptoms, disability, and mortality are all known to differ between ethnic groups and men and women [23,24], we grouped the population by gender. By using the trajectories analysis, we demonstrated heterogeneity in the depressive symptoms and their changes over time in older adults, which is consistent with previous longitudinal studies [25,26]. In this study of 12 years of follow-up, 89.2% of men and 86.6% of women had persistent depressive symptoms consistent with the baseline depressive conditions, but 10.8% of men and 13.4% of women had a course of remitting symptoms compared with baseline. The mortality risk of this remitting group was similar or lower than the trajectory group with the lower depressive symptom scores at baseline (moderate high group).
Although the mechanisms for the association between depressive symptoms and mortality remains to be further explored, some explanations may be suggested. Firstly, depressive symptoms from various origins can primarily represent major depressive disorder, or present secondarily to other medical conditions. They also can reflect a psychological reaction to an individual’s burden of comorbid disease or to other stressful situations [27]. Therefore, these medical conditions or comorbid diseases may mediate the association of depressive symptoms and mortality. Secondly, depressive symptoms, functional disability, and cognitive impairment are all common parameters of morbidity that increase with age [28] and are associated with one another. Some debates may exist as to whether depression that seems to increase the risk of mortality can be treated, thus postponing death [29] or whether it is a phenomenon of various other conditions that are the actual causes of impending death.
Several limitations should be considered when interpreting our outcomes [17]. First, only all-cause mortality was assessed. The associations with cause-specific mortality, such as death from cardiovascular or other causes should be investigated in later studies. Second, the participants of the KLoSA were residents enrolled nationwide to form a nationally representative database. Individuals in long-term care facilities were not included in this study [17]. Therefore, this analysis of the effect of depression on mortality could have limitations among people with high levels of frailty. Third, our data on depression are limited to symptoms, rather than syndromes or disorders. Finally, since the medication history of anti-depressants and the other medications that could affect on the depressive symptoms was not collected, our data was insufficient in examining the effects of treatment on mortality.
Nevertheless, this study has notable important strengths. First, because depressive symptoms may be transient, persistent, or recurrent, the baseline depression scale cannot reflect the natural course of depression in the long-term study periods. We can overcome this limitation by adopting trajectory analysis using multiple measures of depressive symptoms. Second, this is the first study to identify the heterogeneity of depressive symptom trajectories and show its association with mortality in the older population in Korea. It was carried out prospectively over more than a decade in a large representative community-based cohort. Therefore, this finding can be generalized to the Korean people. Third, depression is known to be associated with smoking, impaired social support, unmarried status, and poor self-rated health [30]. Multiple sociodemographic and behavioral variables (age, marital status, education, comorbidity, smoking, drinking, and exercise) were adjusted during analysis.
In conclusion, different trajectories of depression identified by repeated measures of depressive symptoms were associated with different risk of mortality, with highly depressive symptoms increasing over a 12 years period associated with the highest risk of mortality in Korean older people. Despite having a similar baseline level of mood symptoms with the high increasing group (HIT), the remitting depressive symptoms trajectory group (HDT) experienced a lower mortality risk in both men and women. Further studies are necessary to determine the mechanism of these results in more detail.
Supplementary materials
Comparison of BICs from selected model fitted