


Relationship between Hypertension and Mircroalbuminuria according to Obesity Status in Prediabetes
-
Jieun Chu
 , Seon Cho, Suyoung Kim, Eunjoo Kwon, Eun-Hee Nah
- Received August 05, 2019 Revised October 18, 2019 Accepted November 12, 2019
- ABSTRACT
-
- Background
- Microalbuminuria (MA) is a predictor for diabetic nephropathy and mortality of cardiovascular disease. Diabetic nephropathy can be prevented by blood glucose and blood pressure control. Koreans have been found to have a significantly higher risk of type 2 diabetes than Caucasians, despite having normal weights. It is necessary to consider obesity status in the prevention of type 2 diabetes. This study aimed to determine the relationship between MA and hypertension according to obesity status in prediabetes.
- Methods
- This study was retrospectively conducted in 1,183 prediabetes, aged 30-70 years with fasting blood glucose levels of 100-125 mg/dL or hemoglobin A1c levels of 5.7–6.4% who health examinees at 16 health promotion centers from 2015 to 2016. Study subjects were classified according to obesity and hypertension. Obesity is defined as body mass index of ≥25 kg/m2. Blood pressure was categorized as follows: normal blood pressure, <120/80 mmHg; prehypertension, 120–139/80–89 mmHg; and hypertension, ≥140/90 mmHg. We analyzed the relationship between MA and hypertension according to obesity using multivariable logistic regression analysis.
- Results
- While both prehypertensive and hypertensive subgroups were significantly associated with MA in the nonobese, the hypertensive subgroup was only associated with MA in the obese. In the combined effects of obesity and hypertension, prediabetes with normal weight and hypertension had the highest risk of MA (adjusted odds ratio, 6.39; 95% confidence interval, 2.90–14.10) compared to those with nonobese and normal blood pressure.
- Conclusions
- Our findings suggest that nonobese prediabetes with hypertension would need to be more concerned about MA than do obese prediabetes with hypertension.
- REFERENCES
- REFERENCES
- 1. Korean Diabetes Association. Diabetes. 5th ed. Seoul: PanMun; 2018.2. Bahar A, Makhlough A, Yousefi A, Kashi Z, Abediankenari S. Correlation between prediabetes conditions and microalbuminuria. Nephrourol Mon 2013;5(2):741-744.
[Article] [PubMed] [PMC]3. Markus MRP, Ittermann T, Baumeister SE, Huth C, Thorand B, Herder C, et al. Prediabetes is associated with microalbuminuria, reduced kidney function and chronic kidney disease in the general population The KORA (Cooperative Health Research in the Augsburg Region) F4-Study. Nutr Metab Cardiovasc Dis 2018;28(3):234-242.
[PubMed]4. Kim CH, Kim KJ, Kim BY, Jung CH, Mok JO, Kang SK, et al. Prediabetes is not independently associated with microalbuminuria in Korean general population: the Korea National Health and Nutrition Examination Survey 2011-2012 (KNHANES V-2,3). Diabetes Res Clin Pract 2014;106(2):e18-e21.
[Article] [PubMed]5. Kee YK, Han SH. Recent updates on diabetic nephropathy. J Korean Diabetes 2017;18(4):214-228.
[Article]6. Seo MH, Jee Y, Yoo BW, Hong SH, Cho CY, Cho YJ, et al. Relationship between body mass index and microalbuminuria in healthy adults. Korean J Fam Pract 2018;8(1):80-86.
[Article]7. Nah EH, Cho S, Kim S, Cho HI. Comparison of urine albumin-to-creatinine ratio (ACR) between ACR strip test and quantitative test in prediabetes and diabetes. Ann Lab Med 2017;37(1):28-33.
[Article] [PubMed] [PMC]8. American Diabetes Association. Executive summary: standards of medical care in diabetes--2012. Diabetes Care 2012;35 Suppl 1:S4-S10.
[Article] [PubMed] [PMC]9. Jensen JS, Feldt-Rasmussen B, Strandgaard S, Schroll M, Borch-Johnsen K. Arterial hypertension, microalbuminuria, and risk of ischemic heart disease. Hypertension 2000;35(4):898-903.
[Article] [PubMed]10. Bianchi S, Bigazzi R, Campese VM. Microalbuminuria in essential hypertension: significance, pathophysiology, and therapeutic implications. Am J Kidney Dis 1999;34(6):973-995.
[Article] [PubMed]11. Colosia AD, Palencia R, Khan S. Prevalence of hypertension and obesity in patients with type 2 diabetes mellitus in observational studies: a systematic literature review. Diabetes Metab Syndr Obes 2013;17(6):327-338.
[Article] [PubMed] [PMC]12. Korean Diabetes Association. Diabetes Fact Sheet in Korea 2018 [Internet]. Seoul: Korean Diabetes Association; 2018;Accessed Jul 1, 2019]. Available from: http://www.diabetes.or.kr/pro/news/admin.php?mode=list&category=A.13. Yang L, Chu TK, Lian J, Lo CW, Lau PK, Nan H, et al. Risk factors of chronic kidney diseases in Chinese adults with type 2 diabetes. Sci Rep 2018;8(1):14686.
[Article] [PubMed] [PMC]14. Kramer H, Reboussin D, Bertoni AG, Marcovina S, Lipkin E, Greenway FL 3rd, et al. Obesity and albuminuria among adults with type 2 diabetes: the Look AHEAD (Action for Health in Diabetes) Study. Diabetes Care 2009;32(5):851-853.
[PubMed] [PMC]15. Mohammedi K, Chalmers J, Herrington W, Li Q, Mancia G, Marre M, et al. Associations between body mass index and the risk of renal events in patients with type 2 diabetes. Nutr Diabetes 2018;8(1):7.
[Article] [PubMed] [PMC]16. Won JC, Lee YJ, Kim JM, Han SY, Noh JH, Ko KS, et al. Prevalence of and factors associated with albuminuria in the Korean adult population: the 2011 Korea National Health and Nutrition Examination Survey. PLoS One 2013;8(12):e83273.
[Article] [PubMed] [PMC]17. Center for Disease Control and Prevention. National diabetes statistics report 2017 [Internet]. Atlanta: Center for Disease Control and Prevention; 2017;Accessed Jul 1, 2019]. Available from: https://www.cdc.gov/diabetes/data/statistics-report/index.html18. Kodama K, Tojjar D, Yamada S, Toda KJ, Patel CJ, Butte A. Ethnic differences in the relationship between insulin sensitivity and insulin response: a systematic review and meta-analysis. Diabetes Care 2013;36(6):1789-1796.
[PubMed] [PMC]19. Lee YJ, Lim HJ, Park SI. Characteristics of non-obese diabetes in Korean population. Public Health Weekly Report 2017;10(30):780-787.20. Eckel N, Mühlenbruch K, Meidtner K, Boeing H, Stefan N, Schulze MB. Characterization of metabolically unhealthy normal-weight individuals: risk factors and their associations with type 2 diabetes. Metabolism 2015;64(8):862-871.
[Article] [PubMed]21. World Health Organization. The Asia-Pacific perspective : redefining obesity and its treatment [Internet]. Sydney: World Health Organization, Regional Office for the Western Pacific; 2000;Accessed Oct 11, 2019]. Available from: https://apps.who.int/iris/handle/10665/20693622. Stefan N, Schick F, Häring HU. Causes, characteristics, and consequences of metabolically unhealthy normal weight in humans. Cell Metab 2017;26(2):292-300.
[Article] [PubMed]23. Park J, Ahmadi SF, Streja E, Molnar MZ, Flegal KM, Gillen D, et al. Obesity paradox in end-stage kidney disease patients. Prog Cardiovasc Dis 2014;56(4):415-425.
[Article] [PubMed] [PMC]24. Wu S, Dong K, Wang J, Bi Y. Tumor necrosis factor alpha improves glucose homeostasis in diabetic mice independent with tumor necrosis factor receptor 1 and tumor necrosis factor receptor. Endocr J 2018;65(6):601-609.
[Article] [PubMed]25. Panahi MH, Hadaegh F, Yavari P, Kazempour-Ardebili S, Mehrabi Y, Azizi F, et al. A Challenging interaction of chronic kidney disease with other metabolic disorders: paradoxes in cardiometabolic risk factors. Iran J Kidney Dis 2016;10(5):274-281.
[PubMed]26. Rhee CM, Ahmadi SF, Kalantar-Zadeh K. The dual roles of obesity in chronic kidney disease: a review of the current literature. Curr Opin Nephrol Hypertens 2016;25(3):208-216.
[PubMed] [PMC]
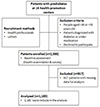
Table 1
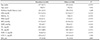
Values are presented as mean±standard deviation or number (%).
Abbreviations: BMI, body mass index; DBP, diastolic blood pressure; FBS, fasting blood sugar; HbA1c, hemoglobin A1c; HDL-C, high-density lipoprotein cholesterol; LDL-C, low-density lipoprotein cholesterol; MA, microalbuminuria; SBP, systolic blood pressure; TC, total cholesterol; TG, triglyceride.
aThe Student's t-test or chi-square test were used.
Table 2
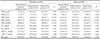
Values are presented as mean±standard deviation or number (%).
Abbreviations: BMI, body mass index; DBP, diastolic blood pressure; FBS, fasting blood sugar; HbA1c, hemoglobin A1c; HDL-C, high-density lipoprotein cholesterol; LDL-C, low-density lipoprotein cholesterol; MA, microalbuminuria; SBP, systolic blood pressure; TC, total cholesterol; TG, triglyceride.
aThe ANOVA or chi-square test were used.
Table 3
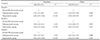
Model 1: a univariable logistic regression model. Model 2: a multivariable logistic regression model adjusted for sex, age, diabetes family history. Model 3: a multivariable logistic regression model adjusted for sex, age, diabetes family history, FBS, HbA1c, TC, TG, LDL-C, HDL-C.
Abbreviations: CI, confidence interval; FBS, fasting blood sugar; HbA1c, hemoglobin A1c; HDL-C, high-density lipoprotein cholesterol; LDL-C, low-density lipoprotein cholesterol; MA, microalbuminuria; OR, odds ratio; TC, total cholesterol; TG, triglyceride.
aOR and 95% CI are calculated with logistic regression.
Table 4
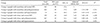
Abbreviations: BP, blood pressure; CI, confidence interval; MA, microalbuminuria; OR, odds ratio.
aAdjusted for age, sex, diabetes family history, fasting blood sugar, hemoglobin A1c, total cholesterol, triglyceride, low-density lipoprotein cholesterol, high-density lipoprotein cholesterol.
bOR and 95% CI are calculated with multiple logistic regression.