


Effects of Bicycle Ergometer Exercise on Cerebral Blood Flow Velocity and Electroencephalogram Response in Normoxia and Hypoxia
-
Seong Dae Kim1, Myung Wha Kim2, Il Gyu Jeong1

- Received February 26, 2019 Revised March 21, 2019 Accepted March 22, 2019
- ABSTRACT
-
- Background
- The cerebral blood flow velocity (CBFV) has been known to increase in response to acute hypoxia. However, how CBFV might respond to exercise in hypoxic conditions and be associated with electroencephalogram (EEG) remains unclear. The purpose of this study was to evaluate the effect of exercise in hypoxic conditions corresponding to altitudes of 4,000 m on CBFV and EEG.
- Methods
- In a randomized, double-blind, balanced crossover study, ten healthy volunteers (19.8±0.4 years) were asked to perform the incremental bicycle ergometer exercise twice in hypoxic and control (sea level) conditions with a 1-week interval, respectively. Exercise intensity was set initially at 50 W and increased by 25 W every 2 minutes to 125 W. Acute normobaric hypoxic condition was maintained for 45 minutes using low oxygen gas mixture. CBFV in the middle cerebral artery (MCA) and EEG were measured at rest 5 minutes, rest 15 minutes, immediately after exercise, and 15 minutes recovery using transcranial-Doppler sonography and EEG signal was recorded from 6 scalp sites leading to analysis of alpha and beta wave relative activities. All data were analyzed using two-way repeated-measures analysis of variance and Pearson's correlation.
- Results
- CBFV in the MCA in the hypoxic condition was significantly higher than that in the control condition at rest 5 minutes (83±9 vs. 69±9 cm/s, P<0.01), rest 15 minutes (87±8 vs. 67±7 cm/s, P<0.001), immediately after exercise (112±9 vs. 97±9 cm/s, P<0.01), and 15 minutes recovery (91±11 vs. 74±7 cm/s, P<0.01). However, no significant correlation was found between the changes of CBFV and EEG wave activities.
- Conclusions
- These results suggest that the drastic change of CBFV observed during exercise with hypoxia might appear independently with EEG wave activities.
- REFERENCES
- REFERENCES
- 1. Secher NH, Seifert T, Van Lieshout JJ. Cerebral blood flow and metabolism during exercise: implications for fatigue. J Appl Physiol 2008;104(1):306-314.
[Article] [PubMed]2. Ogoh S, Ainslie PN. Cerebral blood flow during exercise: mechanisms of regulation. J Appl Physiol 2009;107(5):1370-1380.
[Article] [PubMed]3. Schneider S, Strüder HK. Monitoring effects of acute hypoxia on brain cortical activity by using electromagnetic tomography. Behav Brain Res 2009;197(2):476-480.
[Article] [PubMed]4. Feddersen B, Neupane P, Thanbichler F, Hadolt I, Sattelmeyer V, Pfefferkorn T, et al. Regional differences in the cerebral blood flow velocity response to hypobaric hypoxia at high altitudes. J Cereb Blood Flow Metab 2015;35(11):1846-1851.
[Article] [PubMed] [PMC]5. Imray CH, Myers SD, Pattinson KT, Bradwell AR, Chan CW, Harris S, et al. Effect of exercise on cerebral perfusion in humans at high altitude. J Appl Physiol 2005;99(2):699-706.
[Article] [PubMed]6. Gupta AK, Menon DK, Czosnyka M, Smielewski P, Jones JG. Thresholds for hypoxic cerebral vasodilation in volunteers. Anesth Analg 1997;85(4):817-820.
[Article] [PubMed]7. Ainslie PN, Barach A, Murrell C, Hamlin M, Hellemans J, Ogoh S. Alterations in cerebral autoregulation and cerebral blood flow velocity during acute hypoxia: rest and exercise. Am J Physiol Heart Circ Physiol 2007;292(2):H976-H983.
[Article] [PubMed]8. Ozaki H, Watanabe S, Suzuki H. Topographic EEG changes due to hypobaric hypoxia at simulated high altitude. Electroencephalogr Clin Neurophysiol 1995;94(5):349-356.
[Article] [PubMed]9. Martin D, Powers S, Cicale M, Collop N, Huang D, Criswell D. Validity of pulse oximetry during exercise in elite endurance athletes. J Appl Physiol 1992;72(2):455-488.
[Article] [PubMed]10. Moraine JJ, Lamotte M, Berré J, Niset G. Leduc A, Naeijel R. Relationship of middle cerebral artery blood flow velocity to intensity during dynamic exercise in normal subjects. Eur J Appl Physiol Occup Physiol 1993;67(1):35-38.
[PubMed]11. Ogoh S, Brothers RM, Barnes Q, Eubank WL, Hawkins MN, Purkayastha S, et al. The effect of changes in cardiac output on middle cerebral artery mean blood velocity at rest and during exercise. J Physiol 2005;569(Pt 2):697-704.
[Article] [PubMed] [PMC]12. Huang SY, Tawney KW, Bender PR, Groves BM, McCullough RE, McCullough RG, et al. Internal carotid flow velocity with exercise before and after acclimatization to 4,300 m. J Appl Physiol 1991;71(4):1469-1476.
[Article] [PubMed]13. Yamamoto Y, Hoshika Y, Miyashita M. Effects of acute exposure to simulated altitude on heart rate variability during exercise. J Appl Physiol 1996;81(3):1223-1229.
[Article] [PubMed]14. Patel S, Huang DL, Sagher O. Sympathetic mechanisms in cerebral blood flow alterations induced by spinal cord stimulation. J Neurosurg 2003;99(4):754-761.
[Article] [PubMed]
Figure 1
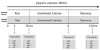
Figure 2
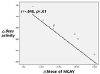

Table 2
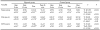
Values are presented as mean±standard deviation.
F values are calculated by two-way repeated-measures ANOVA.
Abbreviations: EDV, maximum end-diastolic velocity; G, group; Mean, mean flow velocity; Peak, peak systolic velocity; T, time.
aSignificantly different from rest (P<0.05).
bSignificantly different from control group (P<0.05).
cSignificantly different from control group (P<0.01).
dSignificantly different from control group (P<0.001).
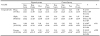
Table 4

Values are presented as mean±standard deviation.
F values are calculated by two-way repeated-measures ANOVA.
Abbreviations: G, group; SaO2, arterial oxygen saturation; T, time.
aSignificantly different from rest (P<0.05).
bSignificantly different from control group (P<0.05).
cSignificantly different from control group (P<0.01).
dSignificantly different from control group (P<0.001).