


Accuracy of Capillary Blood Glucose Test When Fasting in Diabetes Patients or General Population: Performance Evaluation of G300 Based on ISO 15197:2013 Standards
-
Young-min Jee1,2, Min-hee Seo1,2, Byung-wook Yoo1,2
 , Sung-ho Hong1,2, Choo-yon Cho1,2, Yong-jin Cho1,3, Jung-eun Oh1,3, Kyung-suk Shin1,4
- Received August 04, 2017 Accepted September 24, 2017
- ABSTRACT
-
- Background
- Self-monitoring of blood glucose plays an important role in management of diabetes mellitus. Blood glucose measurement is based on using plasma glucose separated from whole blood, but many people with diabetes and health care providers use a portable glucose meter for convenience. The aim of this study was to evaluate the accuracy and agreement of G300 portable glucose monitoring system against standard venous glucose testing methods, based on ISO 15197:2013 standards.
- Methods
- This study was the evaluation of G300 system accuracy following ISO 15197:2013 standards. We estimated precision, system accuracy, hematocrit interference, interfering substances, and user performance.
- Results
- In repeatability precision evaluation of those glucometers, standard deviation was 2.9–3.7 mg/dL at glucose levels under 100 mg/dL and coefficient of variation was 1.7–3.2% at glucose levels over 100 mg/dL, respectively. In accuracy evaluation, 99.5% of difference values between results of G300 portable glucose monitoring system and clinical laboratory were within 95%. Consensus Error grid analysis showed that all values (100%) are within zone A. Hematocrit range between 20% and 60% did not cause interference. These results were acceptable for the ISO15197:2013 criteria in all glucose concentrations.
- Conclusions
- This study showed that G300 can provide reliable blood glucose results for patients and health care providers to manage diabetes mellitus, satisfying the ISO 15197:2013 criteria.
- NOTES
- NOTES
Research grant benefits : Green Cross Medical Science(IRB number : SCHUH 2016-10-016-004).
- REFERENCES
- REFERENCES
- 1. Ohkubo Y, Kishikawa H, Araki E, Miyata T, Isami S, Motoyoshi S, et al. Intensive insulin therapy prevents the progression of diabetic microvascular complications in Japanese patients with non-insulin-dependent diabetes mellitus: a randomized prospective 6-year study. Diabetes Res Clin Pract 1995;28(2):103-117.
[Article] [PubMed]2. Turner RC, Cull CA, Frighi V, Holman RR. Glycemic control with diet, sulfonylurea, metformin, or insulin in patients with type 2 diabetes mellitus: progressive requirement for multiple therapies (UKPDS 49). UK Prospective Diabetes Study (UKPDS) Group. JAMA 1999;281(21):2005-2012.
[Article] [PubMed]3. Diabetes Control and Complications Trial Research Group. Nathan DM, Genuth S, Lachin J, Cleary P, Crofford O, et al. The effect of intensive treatment of diabetes on the development and progression of long-term complications in insulin-dependent diabetes mellitus. N Engl J Med 1993;329(14):977-986.
[Article] [PubMed]4. Karter AJ. Role of self-monitoring of blood glucose in glycemic control. Endocr Pract 2006;12:Suppl 1. 110-117.
[Article] [PubMed] [PMC]5. Welschen LM, Bloemendal E, Nijpels G, Dekker JM, Heine RJ, Stalman WA, et al. Self-monitoring of blood glucose in patients with type 2 diabetes who are not using insulin: a systematic review. Diabetes Care 2005;28(6):1510-1517.
[PubMed]6. Sacks DB, Arnold M, Bakris GL, Bruns DE, Horvath AR, Kirkman MS, et al. Guidelines and recommendations for laboratory analysis in the diagnosis and management of diabetes mellitus. Diabetes Care 2011;34(6):e61-e99.
[Article] [PubMed] [PMC]7. An D, Chung HJ, Lee HW, Lee W, Chun S, Min WK. Analytical performance evaluation of glucose monitoring system following ISO15197. Korean J Lab Med 2009;29(5):423-429.
[Article] [PubMed]
Figure 1
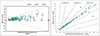
Figure 2
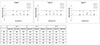
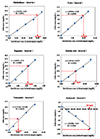
Figure 4
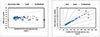
Table 1

Abbreviations: YSI, yellow springs instruments; SD, standard deviation; CV, coefficient of variation.
Acceptance criteria: <100 mg/dL: SD less than 5 mg/dL, ≥100 mg/dL: CV less than 5%. The numbers in the farthest left of the table represent 5 consecutive intervals of concentration levels (30–50 mg/dL, 51–110 mg/dL, 111–150 mg/dL, 151–250 mg/dL, 251–400 mg/dL) to which blood glucose concentrations sampled from patients belong to.
Table 2
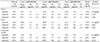
Abbreviations: Conc., concentration; SD, standard deviation; CV, coefficient of variation.
Acceptance criteria: <100 mg/dL: SD less than 5 mg/dL, ≥100 mg/dL: CV less than 5%. The intervals 1 to 3 represent 3 intervals of blood glucose concentrations (30–50 mg/dL, 96–144 mg/dL, 280–420 mg/dL) and the numbers next to them are blood glucose concentrations of the samples of controls provided by the manufacturers accordingly to each intervals.

Table 4
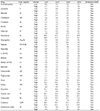
Abbreviations: Conc., concentration; EDTA, ethylenediaminetetraacetic acid; L-DOPA, L-3, 4-dihydroxyphenylalanine; DOPA, dihydroxyphenylalanine.
Glucose low: 50–100 mg/dL, high: 250–350 mg/dL.
aEach result from Lot1, Lot2, Lot3, and AVG means average of difference from control sample 10 times repeated measurement. Acceptance criteria is that difference from control sample was within ±10 mg/dL in low glucose interval (<100 mg/dL) and difference from control sample was within ±10% in high glucose interval (≥100 mg/dL).