



 Corresponding author: Bo-Kyung SHINE, MD, PhD Department of Family Medicine, Dong-A University Hospital, Dong-A University College of Medicine, 26 Daesingongwon-ro, Seo-gu, Busan 49201, Korea
 INTRODUCTION
Metabolic dysfunction-associated steatotic liver disease (MASLD) is one of the most common causes of chronic liver disease worldwide and is closely associated with obesity, insulin resistance, dyslipidemia, type 2 diabetes, and cardiovascular disease [1-6]. The conceptual shift from nonalcoholic fatty liver disease (NAFLD) to MASLD reflects the increasing emphasis on the metabolic context of steatotic liver disease [1,5,6]. Because MASLD includes individuals with diverse metabolic profiles and prognostic trajectories, additional markers that may help refine risk stratification remain clinically relevant.
Although hepatic steatosis is common, prognosis in fatty liver disease is driven more strongly by fibrosis than by steatosis alone [7,8]. Previous longitudinal studies and meta-analyses have shown that fibrosis stage is the strongest predictor of liver-related and overall mortality in NAFLD [7,8]. Therefore, identifying individuals at risk for advanced fibrosis is an important clinical objective in patients with MASLD.
The fibrosis-4 (FIB-4) index is a widely used noninvasive index for fibrosis risk stratification because it is simple, inexpensive, and based on routinely available variables, including age, aspartate aminotransferase (AST), alanine aminotransferase (ALT), and platelet count [9]. Current clinical practice guidelines support the use of FIB-4 as a first-line tool in MASLD pathways [10]. However, FIB-4 is a surrogate index rather than a direct measure of liver fibrosis, and its interpretation can vary according to age and clinical setting [11,12].
Fatty acid composition has also been studied as a potential marker of cardiometabolic and inflammatory risk [13,14]. Arachidonic acid (AA) is an omega-6 polyunsaturated fatty acid (PUFA) and a precursor of eicosanoids involved in inflammatory and thrombotic pathways. Eicosapentaenoic acid (EPA) is an omega-3 PUFA that competes with AA in related enzymatic pathways and is generally linked to less inflammatory or pro-resolving lipid mediators [14,15]. Therefore, the AA/EPA ratio may reflect the balance between omega-6 and omega-3 fatty acid pathways and has been discussed as a marker of inflammatory and cardiometabolic status [13-15].
Previous studies have suggested that the balance between EPA and AA may be related to fatty liver disease and cardiometabolic risk. In a previous study of patients with NAFLD, a lower EPA/AA ratio was proposed as a possible link between NAFLD and cardiovascular disease [16]. Because the AA/EPA ratio used in the present study represents the reciprocal direction of the EPA/AA ratio, a higher AA/EPA ratio may reflect a fatty acid profile relatively shifted toward AA rather than EPA. Biologically, this imbalance may be relevant because AA and EPA compete in lipid mediator pathways involved in inflammation, oxidative stress, thrombosis, and platelet activity [14-18]. These pathways have also been implicated in metabolic liver disease progression and fibrosis-related risk [17,18]. However, evidence from health check-up cohorts directly comparing individuals with and without MASLD remains limited. In addition, few studies have evaluated whether AA/EPA is associated with formula-based fibrosis risk indices such as FIB-4.
Therefore, this study aimed to investigate whether the AA/EPA ratio is associated with MASLD status and FIB-4 in Korean adult health check-up examinees. Because FIB-4 is calculated from age, AST, ALT, and platelet count, we also explored whether individual components of FIB-4 contributed to the observed association between AA/EPA and FIB-4 [9].
METHODS
Study design and setting
This was a single-center cross-sectional study conducted using data from the Health Promotion Center of Dong-A University Hospital, Busan, Republic of Korea. We reviewed adult health check-up examinees between August 2021 and December 2025 who had available fatty acid fraction measurements including AA and EPA.
Study population
A total of 575 health check-up participants were initially screened. Eligible participants were adults aged 19 years or older who underwent comprehensive health check-ups during the study period, had available AA and EPA measurements, underwent abdominal ultrasonography, and had sufficient clinical and laboratory data for the planned analyses.
Participants were excluded according to prespecified criteria, including heavy alcohol consumption (≥30 g/day in males or ≥20 g/day in females), high-dose omega-3 supplementation (approximately ≥1,000 mg/day), viral hepatitis, autoimmune liver disease, or other chronic liver diseases, liver cirrhosis or hepatocellular carcinoma, medication exposure considered likely to materially affect hepatic steatosis or aminotransferase levels, and missing key variables required for the analyses. Medications considered relevant included amiodarone, methotrexate, tamoxifen, valproic acid, systemic corticosteroids, antiretroviral therapy, ursodeoxycholic acid, and biphenyl dimethyl dicarboxylate. Some participants met more than one exclusion criterion. After these exclusions, 392 participants were included in the final analytic sample.
Ethics
This study was performed in accordance with the Declaration of Helsinki and approved by the Institutional Review Board (IRB) of Dong-A University Hospital (IRB approval No. DAUHIRB-26-021; February 4, 2026). The requirement for informed consent was waived by the IRB because this study used retrospectively collected health check-up data.
Metabolic dysfunction-associated steatotic liver disease definition and fibrosis assessment
MASLD was defined as hepatic steatosis detected by abdominal ultrasonography in the presence of at least one cardiometabolic risk factor, according to the current MASLD diagnostic framework [1]. In this cohort, cardiometabolic risk factors were operationalized as follows: body mass index ≥23 kg/m2 or increased waist circumference, defined as ≥90 cm in males and ≥85 cm in females using Korean cutoffs; impaired fasting glucose or diabetes mellitus, defined as fasting glucose ≥100 mg/dL, hemoglobin A1c ≥5.7%, type 2 diabetes, or treatment for type 2 diabetes; elevated blood pressure, defined as blood pressure ≥130/85 mmHg or antihypertensive treatment; and lipid-related cardiometabolic criteria, defined as triglycerides ≥150 mg/dL, high-density lipoprotein cholesterol ≤40 mg/dL in males or ≤50 mg/dL in females, or lipid-lowering treatment.
Multivariable adjustment
Multivariable models were adjusted for clinically relevant variables, including sex, body mass index, smoking status, alcohol intake, diabetes mellitus, dyslipidemia, and hypertension. In the MASLD model, age was additionally included as a covariate. AST and ALT were further included in an additional model to account for liver enzyme levels.
In the primary FIB-4 model, chronological age was not included as an additional covariate to avoid mathematical overlap with the FIB-4 equation [9]. AST, ALT, and platelet count were also not included in the primary FIB-4 model, as they are constituent variables of FIB-4 [9]. Instead, an additional exploratory component-related model including AST, ALT, and platelet count was performed to evaluate whether the association between AA/EPA and FIB-4 was attenuated after accounting for the variables that constitute the index. Given the mathematical relationship between these variables and FIB-4, this model was interpreted as an exploratory component-related analysis rather than as an ordinary confounder-adjusted model.
Statistical analyses
Continuous variables are presented as mean±standard deviation or median (interquartile range), depending on distribution, and categorical variables are presented as number (percentage). Between-group comparisons were performed using the Student’s t-test or Mann-Whitney U-test for continuous variables and the chi-square test or Fisher’s exact test for categorical variables, as appropriate.
Associations between AA/EPA and MASLD were evaluated using logistic regression analysis and are presented as odds ratios (ORs) with 95% confidence intervals (CIs). Associations between AA/EPA and FIB-4 were evaluated using linear regression analysis and are presented as β coefficients with 95% CIs. Prespecified age-stratified analyses were performed using the following age groups: <35, 35–44, 45–54, 55–64, and ≥65 years. An interaction analysis was used to assess effect modification by age group. Exploratory correlation analyses were additionally performed between AA/EPA and AST, ALT, and platelet count to explore which FIB-4 components might contribute to the observed association. All statistical tests were two-sided, and P<0.05 was considered statistically significant.
To clarify the clinical relevance of the association between AA/EPA and FIB-4, additional analyses were performed using conventional FIB-4 risk categories: low risk, <1.3; intermediate risk, 1.3–2.67; and high risk, ≥2.67. AA/EPA distributions across these ordered FIB-4 categories were compared using the Kruskal-Wallis test, and the monotonic trend was assessed using Spearman correlation between AA/EPA and the ordinal FIB-4 category. Pairwise comparisons were performed using Wilcoxon rank-sum tests with Holm adjustment for multiple comparisons.
To address the adequacy of sample size, post-hoc detectable effect size calculations were performed using a two-sided α level of 0.05 and 80% power. With 203 participants in the MASLD group and 189 participants in the non-MASLD group, the study had 80% power to detect a between-group standardized difference of approximately 0.28 or larger. For correlation analyses, the total sample size of 392 participants provided 80% power to detect a correlation coefficient of approximately |r|=0.14 or larger. In MASLD-stratified analyses, the subgroup sample sizes provided 80% power to detect correlation coefficients of approximately |r|=0.20 or larger. Therefore, very small between-group differences or subgroup-specific associations may not have been detected.
Analyses were performed using Python (pandas, scipy, and statsmodels).
RESULTS
Baseline characteristics
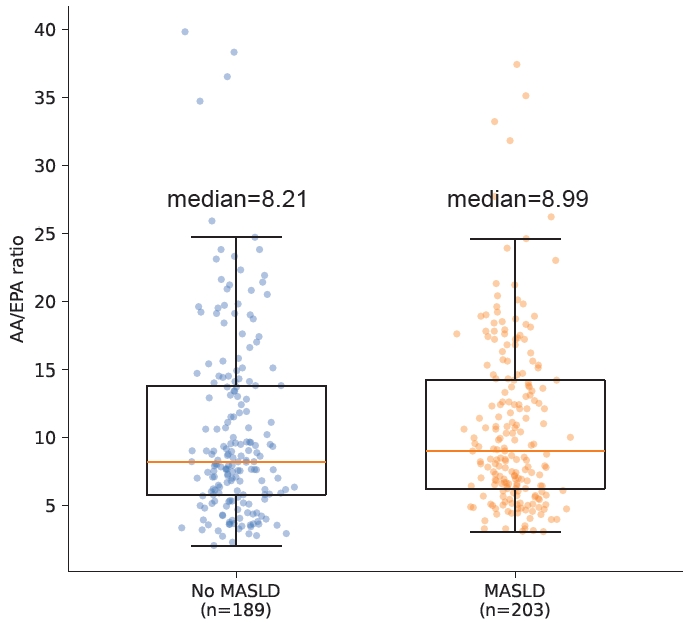
A total of 392 participants were included in the final analysis, of whom 203 (51.8%) met MASLD criteria. Baseline characteristics according to MASLD status are summarized in Table 1. Compared with participants without MASLD, those with MASLD were more often male and had higher body mass index, higher alcohol intake, and higher prevalences of smoking, diabetes mellitus, and hypertension. Liver enzyme levels were also higher in the MASLD group. The AA/EPA ratio did not differ significantly between participants without and with MASLD (median [IQR], 8.21 [5.78–13.80] vs. 8.99 [6.24–14.20]; P=0.30) (Fig. 1). The median FIB-4 index was lower in the MASLD group. Age did not differ significantly between groups, whereas platelet count was significantly higher in the MASLD group. Because FIB-4 is calculated from age, AST, ALT, and platelet count, the lower FIB-4 value in the MASLD group should be interpreted in the context of the composite nature of the index [9].
Association between arachidonic acid-to-eicosapentaenoic acid ratio and metabolic dysfunction-associated steatotic liver disease
The AA/EPA ratio did not differ significantly according to MASLD status and was not associated with MASLD in logistic regression analysis. In the unadjusted model, the OR for MASLD per 1-unit increase in AA/EPA was 1.01 (95% CI, 0.98–1.04). Results were materially unchanged after adjustment for age, sex, body mass index, smoking status, alcohol intake, diabetes mellitus, dyslipidemia, and hypertension (adjusted OR, 1.02; 95% CI, 0.98–1.06) and after further adjustment for AST and ALT (adjusted OR, 1.02; 95% CI, 0.98–1.06). These findings were observed despite marked differences in metabolic characteristics between participants with and without MASLD (Table 2).
Association between arachidonic acid-to-eicosapentaenoic acid ratio and fibrosis-4
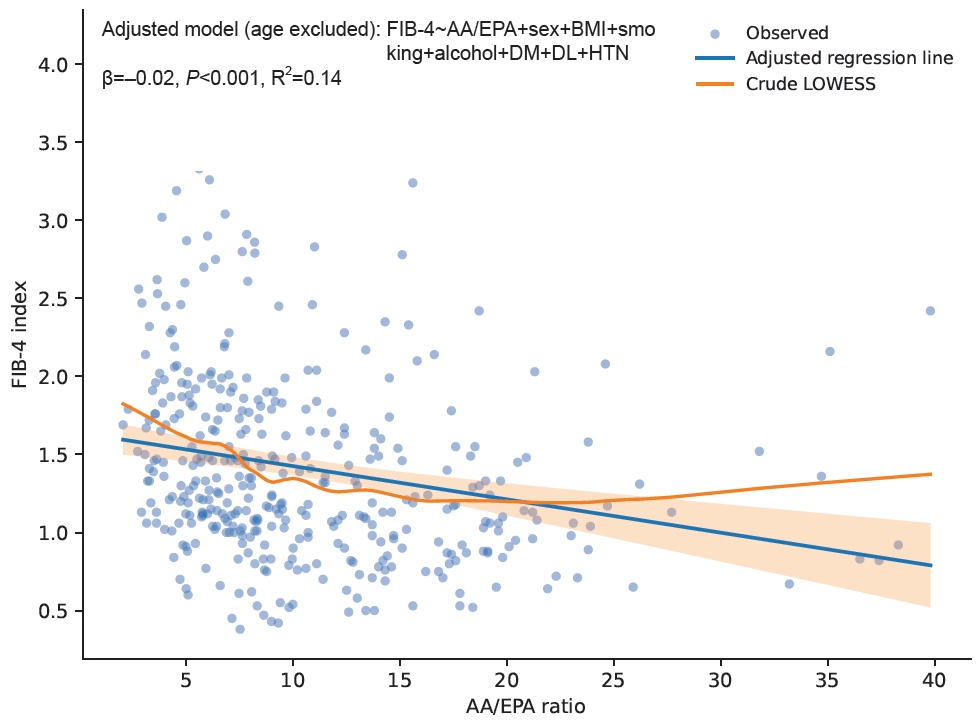
In contrast to the null association observed with MASLD status, the AA/EPA ratio showed a significant inverse association with the FIB-4 index. In unadjusted linear regression, AA/EPA was inversely associated with FIB-4 (β=–0.02; 95% CI, –0.03 to –0.01; P<0.001). This association remained significant after adjustment for sex, body mass index, smoking, alcohol intake, diabetes mellitus, dyslipidemia, and hypertension; age was excluded to avoid mathematical overlap with the FIB-4 equation (adjusted β=–0.02; 95% CI, –0.03 to –0.01; P<0.001). In the exploratory component-related model additionally including AST, ALT, and platelet count, the association was attenuated; however, it remained statistically significant (P<0.001) (Table 3, Fig. 2). Given the mathematical relationship between these variables and FIB-4, this model should not be interpreted as an ordinary confounder-adjusted model [9].
When FIB-4 was categorized using conventional risk cutoffs, AA/EPA differed significantly across the low-risk (<1.3), intermediate-risk (1.3–2.67), and high-risk (≥2.67) groups. The median AA/EPA decreased from 9.99 (IQR, 7.10–15.70) in the low-risk group to 7.48 (IQR, 4.89–11.50) in the intermediate-risk group and 7.00 (IQR, 5.96–8.54) in the high-risk group (P<0.001). A significant inverse trend was observed across ordered FIB-4 categories (Spearman ρ=–0.27; P<0.001). In pairwise comparisons, AA/EPA was significantly lower in the intermediate- and high-risk groups than in the low-risk group, whereas no significant difference was observed between the intermediate- and high-risk groups (Supplementary Table 1).
Additional analyses
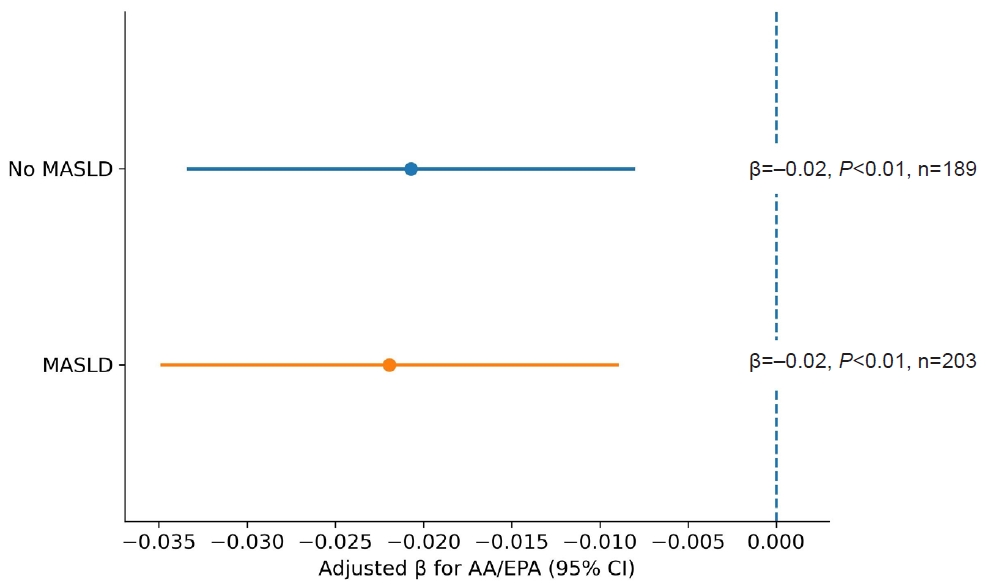
In MASLD-stratified analyses, the inverse association between AA/EPA and FIB-4 was observed both in participants without MASLD and in those with MASLD. In the fully adjusted model excluding age, the association remained significant in both the non-MASLD group (β=–0.02; 95% CI, –0.03 to –0.01; P<0.01) and the MASLD group (β=–0.02; 95% CI, –0.04 to –0.01; P<0.01) (Table 4, Fig. 3). Age-stratified analyses showed generally negative, although non-significant, estimates within individual age groups, with no significant interaction by age group (P for interaction=0.95) (Supplementary Table 2). In exploratory analyses of individual FIB-4 components, AA/EPA was not significantly correlated with AST or ALT, whereas it was positively correlated with platelet count (r=0.18; 95% CI, 0.08 to 0.27; P<0.001) (Table 5).
DISCUSSION
In this single-center cross-sectional study of Korean adult health check-up examinees, the principal finding was a discordant association of AA/EPA with MASLD status and FIB-4. AA/EPA was not associated with MASLD status, whereas it was inversely associated with the FIB-4 index. This association remained significant after multivariable adjustment and was also observed in analyses stratified by MASLD status.
The absence of a significant difference in AA/EPA according to MASLD status should be interpreted carefully. Although the univariate comparison did not show a significant difference between the MASLD and non-MASLD groups, multivariable logistic regression was clinically and methodologically relevant because the two groups differed substantially in sex distribution, body mass index, smoking status, alcohol intake, diabetes mellitus, and hypertension. These factors are closely related to MASLD and may also be associated with fatty acid profiles. Therefore, adjusted analysis was used to evaluate whether AA/EPA had an independent association with MASLD after accounting for major cardiometabolic covariates. The persistence of the null association after adjustment strengthens, rather than weakens, the interpretation that AA/EPA is unlikely to be a useful standalone screening marker for MASLD in this cohort.
These findings should be interpreted in the context of the heterogeneity of MASLD. MASLD includes individuals with diverse metabolic profiles and prognostic trajectories, and the presence of steatosis alone does not fully capture disease severity [5,6]. Previous studies have shown that fibrosis, rather than steatosis itself, is more strongly associated with liver-related and overall mortality in fatty liver disease [7,8]. Therefore, the absence of an association between AA/EPA and MASLD status suggests that AA/EPA is unlikely to serve as a simple screening marker for MASLD in health check-up settings.
The inverse association between AA/EPA and FIB-4 should be interpreted in the context of how FIB-4 is constructed. FIB-4 is a noninvasive index based on age, AST, ALT, and platelet count, rather than a direct measure of liver fibrosis [9,10]. Nevertheless, because FIB-4 is widely used as a first-line tool for fibrosis risk stratification in MASLD care pathways, this association may still be clinically relevant [10-12].
The category-based analysis provided a clinically interpretable description of the continuous FIB-4 finding. AA/EPA was lower in participants with FIB-4 ≥1.3 than in those with FIB-4 <1.3, and an inverse trend was observed across ordered FIB-4 risk categories. However, the high-risk group with FIB-4 ≥2.67 included only 20 participants, and AA/EPA did not differ significantly between the intermediate- and high-risk groups. Therefore, these findings support the direction of the inverse association between AA/EPA and FIB-4, although they do not establish a clear stepwise relationship across the full spectrum of FIB-4 risk.
Previous studies have suggested that EPA/AA or AA/EPA may be related to cardiovascular, inflammatory, and metabolic risk [13-16]. A possible link between EPA/AA and fatty liver disease has also been reported, although prior studies were often conducted in selected patient populations or focused on broader fatty acid profiles rather than direct comparison between individuals with and without MASLD [16-18]. In this context, the present study adds evidence from a health check-up cohort in which MASLD and non-MASLD participants could be directly compared.
The type of blood sample used for fatty acid testing should also be considered. Previous studies have used serum, plasma, whole blood, or red blood cell membrane fractions, and these measures are not directly interchangeable [13,19-23]. In the present study, AA/EPA was derived from red blood cell membrane fatty acid composition. Therefore, direct comparison of absolute values or cutoff levels with studies using serum or plasma-based measurements is limited [19,21-23].
The biological meaning of the observed inverse association requires careful interpretation. AA/EPA was not significantly correlated with AST or ALT, whereas it was positively correlated with platelet count. Because platelet count is located in the denominator of the FIB-4 formula, the inverse association between AA/EPA and FIB-4 may partly reflect platelet-related variation rather than a liver enzyme-driven fibrosis signal [9,10]. This finding highlights an important interpretive issue when fatty acid ratios are analyzed in relation to formula-based fibrosis indices: an observed association with FIB-4 may arise from specific components of the formula rather than from fibrosis-specific hepatic biology.
At the same time, the platelet-related pattern observed in this study may represent more than a formula-driven finding. AA and EPA are involved in lipid mediator pathways related to inflammation, thrombosis, and platelet activity [14,15,17,18,24]. Experimental data have suggested that the EPA/AA balance may influence platelet aggregation and platelet mediator release [25]. However, platelet function and platelet count are not interchangeable, and recent clinical evidence does not support a major increase in bleeding risk with omega-3 PUFA use overall, except for a modest signal in some high-dose purified EPA trials [26]. Accordingly, the AA/EPA–platelet count association observed in this study can be regarded as a hypothesis-generating finding that may link fatty acid composition with platelet-related inflammatory or thrombotic biology and warrants further investigation.
The post-hoc detectable effect size analysis suggested that the overall sample size was sufficient to detect small-to-moderate associations. However, the study may have been underpowered to detect very small between-group differences in AA/EPA according to MASLD status or subtle associations within subgroups. Therefore, the null association between AA/EPA and MASLD should be interpreted as evidence against a clinically meaningful association in this cohort, rather than as proof of no association under all conditions.
This study has several limitations. First, its cross-sectional design precludes any inference regarding causality or temporal sequence. Second, this study was conducted among health check-up examinees at a single hospital, and participants who underwent AA/EPA testing may differ from the general population in socioeconomic status, health awareness, comorbidities, and willingness to undergo optional testing. Therefore, selection bias is possible and the generalizability of the findings may be limited. Third, dietary intake, medication exposure, and supplement use may not have been fully captured, leaving the possibility of residual confounding [14,17,18]. Fourth, the marked male predominance in the MASLD group may have influenced the observed associations [5,6]. Fifth, liver fibrosis was not directly assessed by liver biopsy or elastography; fibrosis-related risk was evaluated using FIB-4, a noninvasive surrogate index [9,10,27,28].
In conclusion, AA/EPA was not associated with MASLD status, whereas it was inversely associated with FIB-4 in this Korean adult health check-up cohort. Category-based analyses supported the direction of this association, whereas component analyses suggested that platelet-related variation, rather than AST or ALT, may partly contribute to the FIB-4 finding. These findings do not support AA/EPA as a simple screening marker for MASLD. Further studies incorporating direct fibrosis assessment, platelet-related parameters, and detailed dietary or supplement information are needed to clarify the biological and clinical significance of the AA/EPA–FIB-4 association.


 PDF Links
 PubReader
 ePub Link
 XML Download
 Full text via DOI
 Download Citation
 Supplement1
 Print
Print