Predictors of Digital Literacy among Older Adults Living in Urban and Rural Areas
Article information

Abstract
Background
This study examined the factors influencing digital literacy among older adults aged 65 and older, focusing on the roles of social capital and life satisfaction in urban and rural contexts.
Methods
A secondary analysis was conducted using microdata from the Digital Information Gap Survey 2023, a nationally representative dataset collected by the National Information Society Agency. Data from 974 seniors aged 65 or older who have experience using the internet and own a mobile device were analyzed using descriptive statistics. In this study, digital literacy was measured by personal computer use ability and mobile use ability. Pearson’s correlation, and hierarchical regression analyses to identify predictors of digital literacy.
Results
Digital literacy was significantly higher in urban areas than in rural areas (t=–5.954, P<0.001). In both settings, younger age, men gender, higher educational attainment, and greater household income were associated with higher digital literacy. Social capital was a significant predictor in urban (β=0.089, P=0.008) and rural (β=0.230, P=0.003) groups, whereas life satisfaction significantly influenced digital literacy only in urban areas (β=0.070, P=0.036). For rural older adults, household type (non–single-person households) was also a significant predictor.
Conclusions
The findings highlight distinct patterns in the determinants of digital literacy between urban and rural older adults. Enhancing social capital and addressing socioeconomic disparities are essential to narrowing the digital divide, particularly in rural areas. Context-sensitive and community-based programs should promote digital inclusion and improve the quality of life among older adults.
INTRODUCTION
In an era of deepening digitalization, the ability to navigate and use digital technologies effectively has become essential for social participation, access to information, and quality of life [1,2]. However, digital literacy remains a significant challenge for older adults aged 65 and above due to diverse cognitive, social, and economic barriers [3,4]. Although the digital divide between generations has been documented adequately, disparities persist within the older adult population, particularly between individuals living in urban and rural areas [5,6]. Understanding the factors influencing digital literacy among older adults is vital for developing policies and interventions that foster meaningful digital engagement.
Broadly, digital literacy encompasses the ability to access, understand, evaluate, and communicate information through digital media [1]. Digital literacy holds particular importance for older adults, as it enables access to online services, healthcare resources, and social networks, enhancing quality of life and mitigating social isolation [2,7]. Nevertheless, digital literacy among older adults varies widely due to individual and contextual factors [3,4].
Two key influencing factors frequently linked to digital literacy are social capital and life satisfaction. Social capital refers to the resources individuals access through social networks and relationships and is a key determinant of digital literacy [8-10]. Older adults with strong social networks, including family, friends, and community organizations, are more likely to receive support and encouragement in adopting digital technologies [7,9,10]. Urban areas, characterized by more diverse and extensive social networks, offer greater opportunities for digital participation than rural areas, where social ties often remain limited to close-knit communities with fewer technology-related interactions [5,6,11]. Moreover, social capital shapes the motivation and confidence of older adults to learn and use digital tools, influencing their overall digital literacy [8,9].
Life satisfaction, reflecting individuals’ general assessment of well-being, is crucial in shaping digital literacy among older adults [8,12]. Individuals reporting higher life satisfaction are more inclined to learn and adopt new digital technologies [12,13]. Conversely, older adults with low life satisfaction, particularly those in rural areas with limited access to social and educational resources, often demonstrate lower digital literacy [5,14]. In addition, it should not be overlooked that in various studies, the mental health satisfaction variable is pointed out as a factor that is correlated with digital literacy [7,8,15,16]. However, in addition to the study that older people with high physical and social satisfaction have easy access to smart media [17], the study of predictive factors for the level of digital information competency also analyzed the effect on the level of digital information competency by selecting life satisfaction as an independent variable [16]. As variables affecting the level of digital utilization ability, a study [15] that analyzes life satisfaction and daily life satisfaction as independent variables by grouping them into physical and mental health variables along with demographic variables can be seen in the same context. Further examination is necessary to understand how social capital and life satisfaction interact to shape digital literacy among older adults, especially across urban and rural contexts [8,14].
A literature review revealed that demographic factors influence the digital literacy of older adults. Mens, those with higher education, younger ages, higher economic status, and those living in multi-person households were found to have higher digital literacy [7,13,15,18,19]. Furthermore, higher life satisfaction among older adults was associated with higher digital information competency [19].
This study investigates the factors influencing digital literacy in adults aged 65 and above, focusing on the roles of social capital and life satisfaction. By comparing urban and rural populations, it aims to offer a more nuanced understanding of the challenges and opportunities older adults face in the digital era. The findings are expected to inform policymakers, educators, and community organizations seeking to promote digital inclusion and enhance the well-being of older adults through targeted interventions and support programs.
METHODS
Study design
This study is a secondary data analysis aimed at determining the predictors of digital literacy among older adults, utilizing a cross-sectional design. The analysis was conducted using data collected from the “Digital Information Gap Survey 2023,” a nationwide sample survey.
Subjects
This study utilized microdata from the “Digital Information Gap Survey 2023,” administered by the Ministry of Science and ICT and conducted by the National Information Society Agency (NIA). The nationwide survey covered individuals aged 7 and older across 17 cities and provinces, with a specific focus on the digital accessibility and utilization capabilities of information-vulnerable groups, including older adults, persons with disabilities, and low-income individuals. Sampling was performed through a multistage stratified systematic method. Professional interviewers visited target households and conducted face-to-face interviews using a structured questionnaire. The participants comprised 974 individuals aged 65 and above who had experience using the internet.
Measures and scales
The measurement tools used in this study - digital literacy, social capital, and life satisfaction - were developed and utilized in the “Digital Information Gap Survey 2023.”
Digital literacy
Digital literacy was assessed based on personal computer and mobile device usage skills. The survey included seven items evaluating how independently individuals could perform computer-related tasks such as installing and uninstalling software, connecting to and using the internet, configuring web browser settings, connecting external devices, transferring files online, scanning for and removing malware, and creating documents or materials. It also contained seven items evaluating the ability to perform mobile device tasks such as adjusting basic settings, configuring wireless networks, transferring files to a computer, installing and using necessary apps, scanning for and treating malware, and creating documents or materials. Each item was rated on a 4-point scale ranging from 1 “strongly disagree” to 4 “strongly agree,” with higher scores indicating greater ability to access and use information through digital devices. This indicator represents a standardized digital competency index developed for the survey, with a Cronbach’s α of 0.96 in this study.
Social capital
Social capital was measured using the Internet Social Capital Scales developed by Williams [20], a shortened scale consisting of 10 items on bridging social capital (outward orientation, contact with a wide range of people, being part of a wider world, etc.) and 10 items on bonding social capital (emotional support, access to limited resources, mobilization for solidarity, etc.), with five items each for the bridging and bonding scales. The bridging social capital scale includes the items “Interacting with people makes me feel connected to the larger world,” “Interacting with people makes me feel connected to everyone in the world,” “I am willing to spend time on community activities,” “Interacting with people allows me to talk to new people,” and “Interacting always allows me to meet new people.” The bonding social capital scale includes items such as “There are people among me who can help me solve my problems,” “There are people among me who I can turn to for advice when making very important decisions,” “There are people among me with whom I can comfortably talk about intimate personal matters,” “There are people among me who I can entrust with important tasks,” and “People will help me fight injustice.” Each item was rated on a 4-point Likert scale ranging from 1 “strongly disagree” to 4 “strongly agree.” The total score was calculated by summing all item responses, with higher scores indicating greater levels of social capital. Cronbach’s α for in this study was 0.87.
Life satisfaction
Life satisfaction was assessed through items evaluating respondents’ subjective perceptions of their overall life. The scale included five items, such as “I am satisfied with my life” and “I have obtained the important things I desire,” rated from 1 “not satisfied at all” to 4 “very satisfied.” Higher scores reflected greater overall life satisfaction. Cronbach’s α for in this study was 0.81.
General characteristics
Variables identified in previous studies to influence the digital literacy of older adults were set as control variables [7,13,15,16,18,19]. The selected variables were age, gender, education level, whether the elderly live alone, whether they are employed, and average monthly household income. For age and monthly household income, descriptive statistics were presented in categories to aid understanding, and were used as continuous variables in regression analysis. Education level was categorized into less than middle school graduation and higher, and occupation was categorized into employed or unemployed. Average monthly household income was divided into three groups: less than 1 million won, 1 to 3 million won, and 3 million won or more. In the hierarchical regression analysis, it was divided into 11 units from less than 1 million won to 10 million won or more, and was entered as a continuous variable. Urban and rural areas were categorized into cities and counties.
Data collection
The data were collected as part of nationally approved statistics. During the survey, all participants received an explanation of the research purpose and personal information protection, and data collection proceeded only after obtaining their informed consent. This study also entailed a secondary analysis, conducted using publicly available microdata provided by the NIA. The analysis relied solely on non-identifiable data that could not be traced to personal information. This study was a secondary data analysis study utilizing public data and was exempted from review by the Institutional Review Board (IRB) of Incheon Catholic University (IRB review number: 2023-ICCU-IRB-05).
Data analysis
The collected data were analyzed using IBM SPSS Statistics (ver. 26; IRB Corp.). The general characteristics of the participants were examined through descriptive statistics, including frequency, percentage, mean, and standard deviation. Relationships among variables were analyzed using Pearson’s correlation, and hierarchical regression analysis was performed to identify factors influencing digital literacy among older adults.
The regression analysis was conducted in three stages. First, demographic variables such as gender, age, and education level were entered. Second, social capital was added; third, life satisfaction was included to complete the model. The enhancement in the explanatory power of the models was assessed by quantifying the variation (ΔR2) in the coefficient of determination (R2) and the statistical significance (P-value). Multicollinearity was examined using the Variance Inflation Factor (VIF).
RESULTS
General characteristics of the subjects and key variable characteristics
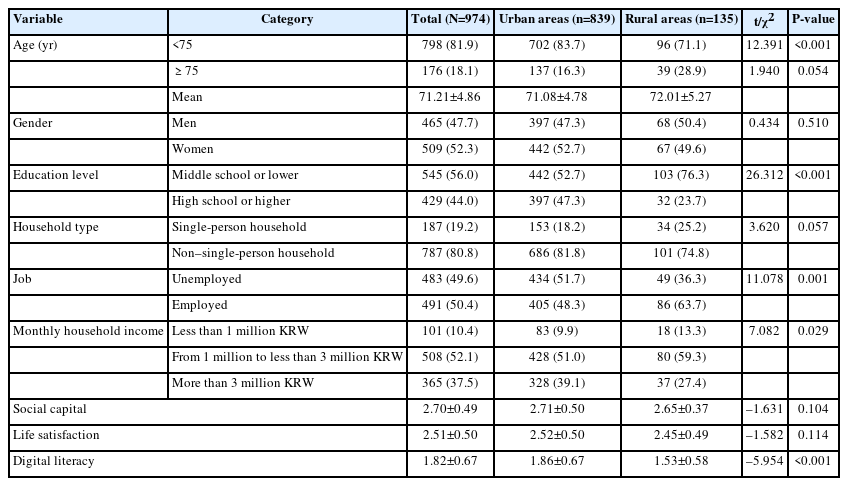
The mean age of participants was 71.21 years (71.08 urban areas and 72.01 rural areas), with women comprising 52.3% of the sample. The representation of each category was as follows: 56.0% for participants with a middle school education or lower; 80.8% for non–single-person households; 50.4% for those who were employed; and 52.1% for those with a monthly household income between KRW 1 million won and KRW 3 million won. As shown in Table 1, digital literacy levels in urban areas were significantly higher than in rural areas (t=–5.954, P<0.001).
General characteristics, social capital, life satisfaction and digital literacy of the subjects
Social capital, life satisfaction, and digital literacy of the subjects
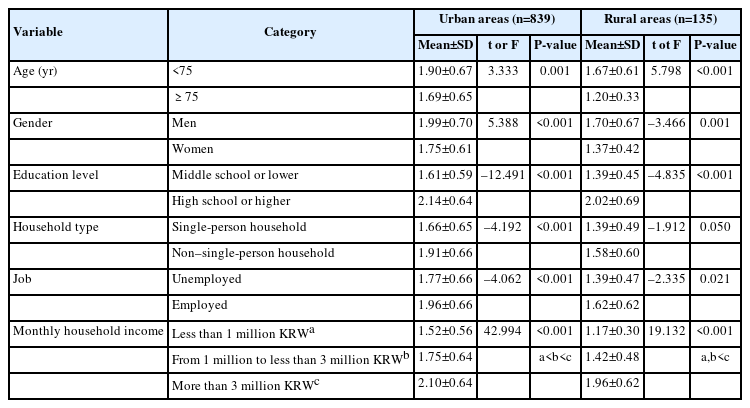
Differences in digital literacy according to general characteristics are presented in Table 2, and all variables were statistically significant.
Comparison of digital literacy according to the general characteristics of the subjects
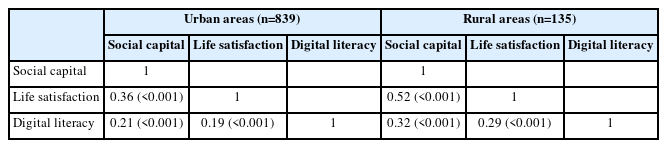
The results of the correlation analysis between key variables by community type are presented in Table 3. In urban areas, social capital was positively correlated with life satisfaction (r=0.36, P<0.001) and digital literacy (r=0.21, P<0.001). In rural areas, positive correlations were also observed between social capital and life satisfaction (r=0.52, P<0.001) and between social capital and digital literacy (r=0.32, P<0.001).
Correlation between social capital, life satisfaction, and digital literacy
Factors affecting digital literacy
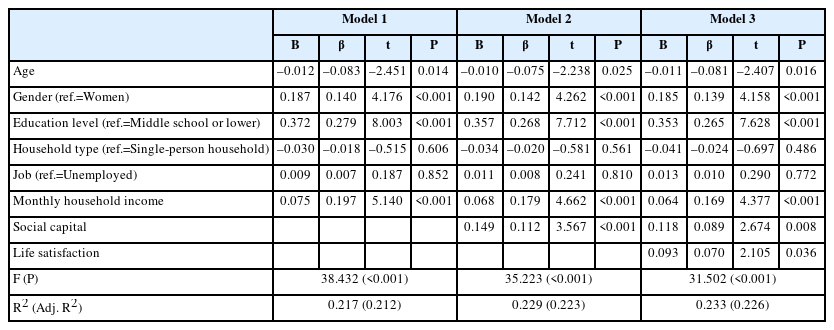
This study employed hierarchical regression analysis to examine the influence of community type—urban versus rural—on the digital literacy of older adults.
As presented in Table 4, the regression model for older adults residing in urban areas was statistically significant (F=31.502, P<0.001), with a Durbin–Watson statistic of 1.152 and all VIF values below 2. Significant predictors of digital literacy included age (β=–0.081, P=0.016), gender (β=0.139, P<0.001), educational attainment (β=0.265, P<0.001), monthly household income (β=0.169, P<0.001), social capital (β=0.089, P=0.008), and life satisfaction (β=0.070, P=0.036). In summary, digital literacy was higher among younger individuals, men participants, those with at least a high school education, a higher household income, greater social capital, and higher life satisfaction.
Factors affecting the digital literacy of older adults in urban areas
As shown in Table 5, the regression model analyzing predictors of digital literacy among older adults residing in rural areas was statistically significant (F=14.253, P<0.001), with a Durbin–Watson statistic of 1.336 and all VIF values below 2. Significant predictors of digital literacy included age (β=–0.205, P=0.008), gender (β=0.176, P=0.018), education level (β=0.295, P<0.001), household type (β=–0.224, P=0.005), monthly household income (β=0.332, P<0.001), and social capital (β=0.230, P=0.003). In summary, digital literacy was higher among younger individuals, mens, those with at least a high school education, non–single-person households, individuals with higher monthly household income, and those with greater social capital.
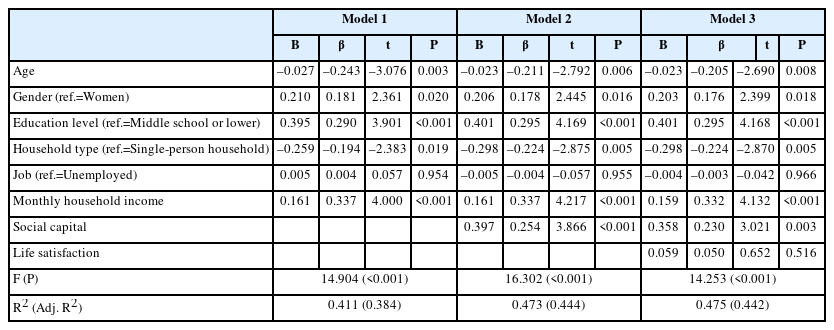
Factors affecting the digital literacy of older adults in rural areas
DISCUSSION
This study examined factors influencing the digital literacy of adults aged 65 and above, focusing on how social capital and life satisfaction affected digital literacy across urban and rural communities. The analysis showed that age, gender, education level, household income, social capital, and life satisfaction were significant predictors of digital literacy overall. However, the strength and direction of some of these factors varied depending on community type [3,4,21].
In urban and rural areas, digital literacy was higher among younger individuals, mens, those with at least a high school education, and those with higher household income. This finding reinforces that a digital divide persists even within the older adult population, a conclusion consistently supported by previous studies [3-6]. It also highlights the importance of education and economic resources as fundamental components of digital literacy [3,21]. In rural areas, non–single-household status was an additional significant predictor—the presence of family members or cohabitants may provide practical help or emotional encouragement for digital technology use [7,9].
Social capital was a significant predictor of digital literacy in urban and rural settings. Its influence was particularly strong among older adults in rural areas—relationship-based social support is critical in bridging the information gap in regions with lower digital accessibility [8-11]. These findings are consistent with prior research demonstrating that social capital facilitates the adoption of digital technology [8-10]. In rural areas, offline community networks appear especially effective, and their use in disseminating information or designing technical training programs can be equally beneficial [11,22].
Life satisfaction was a significant predictor of digital literacy among older adults in urban areas, but did not reach statistical significance among those in rural areas. This result aligns with previous research, which suggests that life satisfaction influences individuals’ interest in, attitudes toward, and willingness to engage with digital technology, as well as their readiness to embrace new challenges, although this effect may depend on regional context [12-14]. As social capital and physical factors such as household type and income exert a stronger influence on digital competency than life satisfaction among older adults in rural areas, the context-dependent and potentially diminished role of life satisfaction in technology adoption should be considered [5,11,14,21].
This study empirically demonstrated a clear disparity in digital literacy levels between urban and rural areas—older adults in rural areas had significantly lower average digital literacy than those in urban areas. This finding reinforces the spatial inequality repeatedly highlighted in previous research on the digital divide, suggesting that disparities in the distribution of physical infrastructure and social and emotional resources affect digital capabilities [5,6,11,14]. Moreover, the results indicate that older adults living in rural areas tend to have lower educational attainment, lower household income, and a higher proportion of single-person households, reflecting structural barriers that limit access to and use of digital technology [5,6,11].
Although our descriptive statistics did not reveal significant mean differences in life satisfaction and social capital between urban and rural areas, prior research suggests that social capital is not a unidimensional construct; rural areas tend to have stronger bonding social capital while urban areas may exhibit greater bridging social capital, which could result in comparable average levels when measured without considering compositional differences [22]. Furthermore, the impact of social capital on subjective well-being has been shown to vary across geographic contexts, potentially due to differences in community associations, infrastructure, and socio-economic conditions [23].
The findings of this study underscore the need for more nuanced, locally tailored intervention strategies to promote digital inclusion among older adults. For those living in urban areas, implementing motivation-enhancing programs that improve life satisfaction and foster autonomous technology learning may be an effective approach [12,13]. For older adults in rural areas, technology education delivered through community-based initiatives, supported by social capital and strengthened by family and local networks, is essential [9,11,22]. In these settings, digital literacy programs should aim to build technical skills and enhance social connectedness and overall life satisfaction [2,7,9,12,13].
As this study was conducted through secondary data analysis, it has some limitations related to variable composition and the depth of measurement items. In particular, the study did not capture the detailed components of social capital (e.g., trust, reciprocity, and participation) with sufficient precision. Moreover, the cross-sectional design precludes definitive conclusions about causality. Future research should employ longitudinal designs or incorporate qualitative approaches to provide a more comprehensive understanding of the processes underlying the development of digital competencies among older adults.
Notes
AUTHOR CONTRIBUTIONS
Dr. Hyunjung MOON had full access to all of the data in the study and takes responsibility for the integrity of the data and the accuracy of the data analysis. Author reviewed this manuscript and agreed to individual contributions.
Conceptualization, data curation, writing–original draft, reviewing & editing: HM.
CONFLICTS OF INTEREST
No existing or potential conflict of interest relevant to this article was reported.
FUNDING
This study was supported by the Incheon Catholic University Research Grant of 2023.
DATA AVAILABILITY
The data presented in this study are available upon reasonable request from the corresponding author.