Identifying the Optimal Waist Circumference-Based Body Adiposity Index for Detecting Metabolically Obese but Normal-Weight Older Koreans: A Cross-Sectional Study
Article information

Abstract
Background
The concept of being metabolically obese but normal weight (MONW) has emerged as a significant public health concern. Individuals with MONW exhibit insulin resistance and are at elevated risk for chronic diseases, despite having a body mass index (BMI) <25 kg/m2. Given the high prevalence of MONW among older Asian adults and the role of abdominal visceral fat in metabolic abnormalities in individuals with MONW, identifying an accurate waist circumference (WC)-based body adiposity index for older Asian adults is essential. Thus, this study aimed to determine the most accurate WC-based body adiposity index for identifying MONW in older Korean adults that are not underweight or obese.
Methods
This cross-sectional study included 7,846 participants (3,536 males and 4,310 females) aged ≥60 years with a BMI of 18.5–24.9 kg/m2 from the Korea National Health and Nutrition Examination Survey. MONW was defined using metabolic syndrome criteria and sex-specific triglyceride‒glucose Index cutoff points. Associations were analyzed using logistic regression, and discriminative ability was assessed using receiver operating characteristic curves. The analysis included BMI, WC and various WC-based adiposity indices, including the visceral adiposity index (VAI), body roundness index, waist-to-height ratio, conicity index, weight-adjusted waist index, and a body shape index.
Results
While all WC-based indices were associated with MONW, only the VAI showed a stronger association (odds ratios [ORs], 26.542 in males and 21.495 in females) and superior discriminative ability (area under the curves [AUCs], 0.826 in males and 0.802 in females) in both sexes compared with WC (ORs, 4.538 and 4.060; AUCs, 0.679 and 0.676). Other indices showed weaker associations and lower areas under the curves than did the VAI and WC, regardless of sex.
Conclusions
The VAI may serve as the most effective indicator for identifying MONW among older Korean adults that are not underweight or obese.
INTRODUCTION
Recently, a new concept of obesity, “metabolically obese but normal weight (MONW)”, has gained attention as a significant public health concern [1,2]. MONW individuals are characterized by insulin resistance and are highly vulnerable to chronic diseases, despite having a body mass index (BMI) <25 kg/m2 [1,3]. Notably, there are substantial numbers of MONW in older Asian adults with type 2 diabetes, cardiovascular disease, or other chronic health concerns [4,5]. The incidences of cardiovascular disease and all-cause mortality for these individuals are even higher than those of their metabolically healthy counterparts with a BMI ≥25 kg/m2 [6,7]. These findings underscore the limitations of BMI, which is a measure of body weight relative to height without considering fat distribution. Many previous reports have demonstrated the need for a more precise indicator of MONW in older Asian adults who do not meet BMI-based obesity criteria to prevent and manage health concerns related to metabolic abnormalities.
Since the accumulation of visceral fat in the abdominal region is considered a key contributor to metabolic abnormalities in MONW individuals, evaluating abdominal obesity is crucial. For years, waist circumference (WC) has been used to evaluate abdominal obesity [8,9]. However, WC is affected by differences in height and overall body size, making it less effective for evaluating abdominal adiposity [10,11]. To address the limitations of WC, several WC-based body adiposity indices, including the visceral adiposity index (VAI), body roundness index (BRI), waist-to-height ratio (WHtR), conicity index (CI), weight-adjusted-waist index (WWI), and a body shape index (ABSI), have been suggested [12-16]. All of these body adiposity indices have been reported as distinguishing indicators of various health concerns [12-16].
A cross-sectional study, involving Brazilian adults aged 20–59 years old, conducted by Ferreira et al. [17] has reported that the VAI showed a better discriminative ability of MONW, compared to BMI, WHtR, waist-to-hip ratio, and waist and neck circumference. However, given the different characteristics in anthropometry, eating and physical activity habits between Europeans and Koreans, it remains uncertain whether the VAI is an equally effective indicator of MONW for older Asian adults. Additionally, the relationship between MONW and these adiposity indices in older Korean adults who are not underweight or obese (18.5≤BMI<25.0 kg/m2) has not yet been studied. Therefore, this study aimed to investigate the associations between WC-based adiposity indices and MONW in older Korean adults. Furthermore, we compared the performance of these indices in discriminating MONW.
METHODS
Study design and participants
This cross-sectional study analyzed data from the Korea National Health and Nutrition Examination Survey (KNHANES) collected between 2014 and 2022. The KNHANES is an ongoing, nationally representative surveillance system established in 1984 to assess the health, nutritional status, and lifestyle behaviors of the Korean population. From the initial dataset, 7,846 individuals (3,536 males and 4,310 females) aged ≥60 years with a BMI between 18.5 and 24.9 kg/m2 were included. All participants provided written informed consent. This study was approved by the Institutional Review Board of Changwon National University (approval number: 7001066-202404-HR-056) and conducted in accordance with the principles of the Declaration of Helsinki.
Measurements and body adiposity indices
Height was measured to the nearest 0.1 cm using a stadiometer with participants standing barefoot. Weight was recorded to the nearest 0.1 kg using a calibrated digital scale while the participants wore light clothing. BMI was obtained using the following formula: weight (kg)/height (m)2. WC was measured to the nearest 0.1 cm using a nonelastic glass fiber tape. Blood pressure was manually measured three times using a standard sphygmomanometer in a mobile examination unit, and the mean of the three readings was used in the analysis. Venous blood samples were drawn in the morning following an overnight fast of more than 8 hours. Serum concentrations of glucose, triglycerides, and high-density lipoprotein (HDL) cholesterol were determined using enzymatic or homogeneous enzymatic colorimetric methods with a Hitachi 7600–210 automatic analyzer (Hitachi). WC-based body adiposity indices, including the VAI, BRI, WHtR, CI, WWI, and ABSI, were computed as described in Table 1.
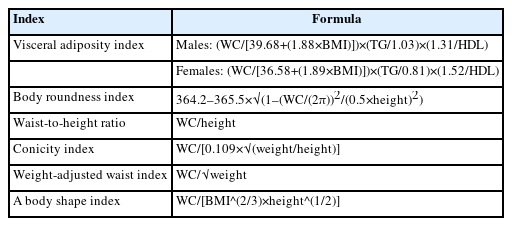
Formulas of WC-based body adiposity indices
Evaluation of metabolically obese but normal weight and metabolically healthy and normal weight
In the current study, participants were classified as MONW if they met either of the two criteria based on the method proposed by Lee et al. [18]: the presence or absence of metabolic syndrome (MS), or exceeding the sex-specific triglyceride glucose (TyG) index cutoff point. Those who met neither criterion were classified as metabolically healthy and normal weight (MHNW) individuals. Because MS encompasses a constellation of metabolic abnormalities, it has been broadly used in previous studies to identify MONW. However, there is a possibility of missing early or subclinical metabolic risks in those with normal weight. Given that the TyG index is a surrogate marker of insulin resistance, it can complement MS criteria by identifying individuals with latent metabolic risk who may otherwise be overlooked. MS was confirmed on the basis of the criteria recommended in 2022 by the Korean Society for the Study of Obesity [19], which require the presence of three or more of the following components: (1) WC ≥90 cm in males and ≥85 cm in females; (2) systolic blood pressure ≥130 mmHg, diastolic blood pressure ≥85 mmHg, or use of antihypertensive medication; (3) fasting plasma triglyceride concentration >150 mg/dL or the use of lipid-lowering medication; (4) fasting HDL-cholesterol concentration <40 mg/dL in males and <50 mg/dL in females, or the use of lipid-lowering medication; and (5) fasting plasma glucose concentration ≥100 mg/dL or the use of antihyperglycemic medication. Additionally, our previous study, which investigated the association between the TyG index and MONW in 4,721 older Korean adults, proposed sex-specific TyG index cutoff points of ≥8.88 for males and ≥8.80 for females [4]. These cutoff points were applied in the current study to identify MONW. The TyG index was calculated as ln [triglyceride concentration (mg/dL)×fasting plasma glucose concentration (mg/dL)/2] [4,20].
Statistical analysis
The independent t-test or the Mann-Whitney U-test was adopted to compare continuous variables between MONW and MHNW. For categorical variables, the chi-square test was applied. The results are presented as the means±standard deviations or numbers (percentages) (Table 2). Logistic regression was performed to assess the sex-specific odds ratios (ORs) concerning the relationships between body adiposity indices and MONW. The fully adjusted model accounted for several confounding factors, such as age, education level, household income, smoking, drinking, physical activity (leisure-time or occupational physical activity, transfer time, and sedentary time), and nutrition (total, carbohydrate, protein, and fat caloric intake). The results are presented as ORs (95% confidence intervals). Statistical analyses were performed using SPSS software, ver. 26.0 (IBM, Inc.) (Table 3). To determine the optimal cutoff points for each sex-specific body adiposity index in identifying MONW individuals, we conducted receiver operating characteristic (ROC) curve analysis. The optimal cutoff points for each index were determined using the Youden index, which seeks to maximize the combined sensitivity and specificity. This analysis utilized MedCalc for Windows ver. 9.1.0.1 (MedCalc Corp.) (Table 4). For all analyses, P<0.05 was considered statistically significant.
Characteristics of study subjects
Sex-specific odds ratios for the association between body adiposity indices and MONW
Sex-specific AUC comparisons for body adiposity indices in identifying MONW
RESULTS
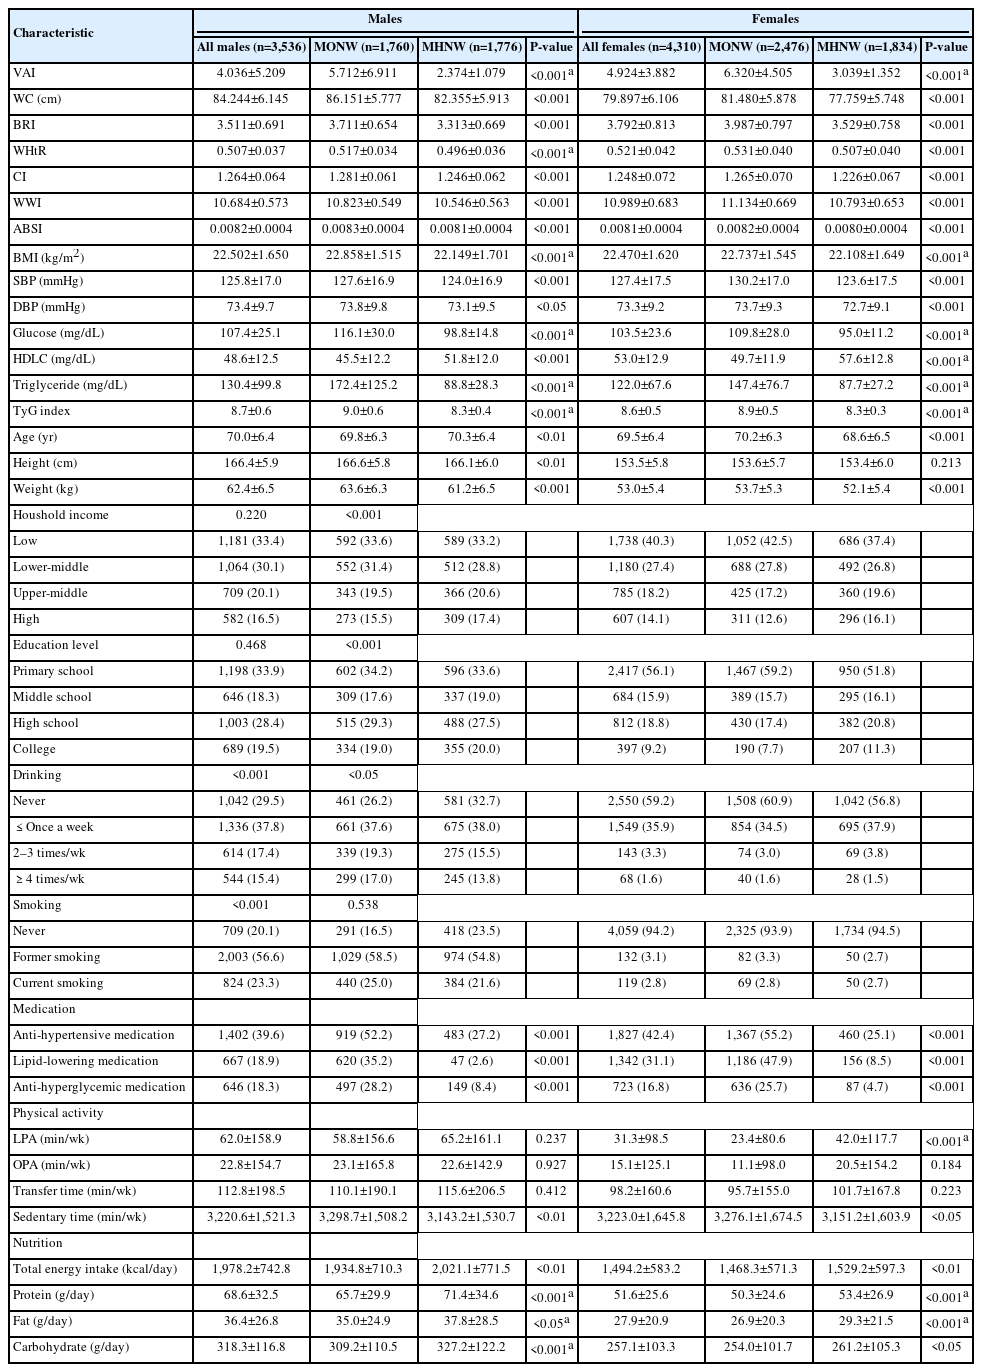
Table 2 presents the characteristics of the study participants. The mean age was 70.0±6.4 years for males and 69.5±6.4 years for females. In both sexes, all body adiposity indices in the MONW group were greater than those in their counterparts (P<0.001 for all). Similarly, all MS components and the TyG index were greater in the MONW group than in the MHNW group (P<0.05 for all).
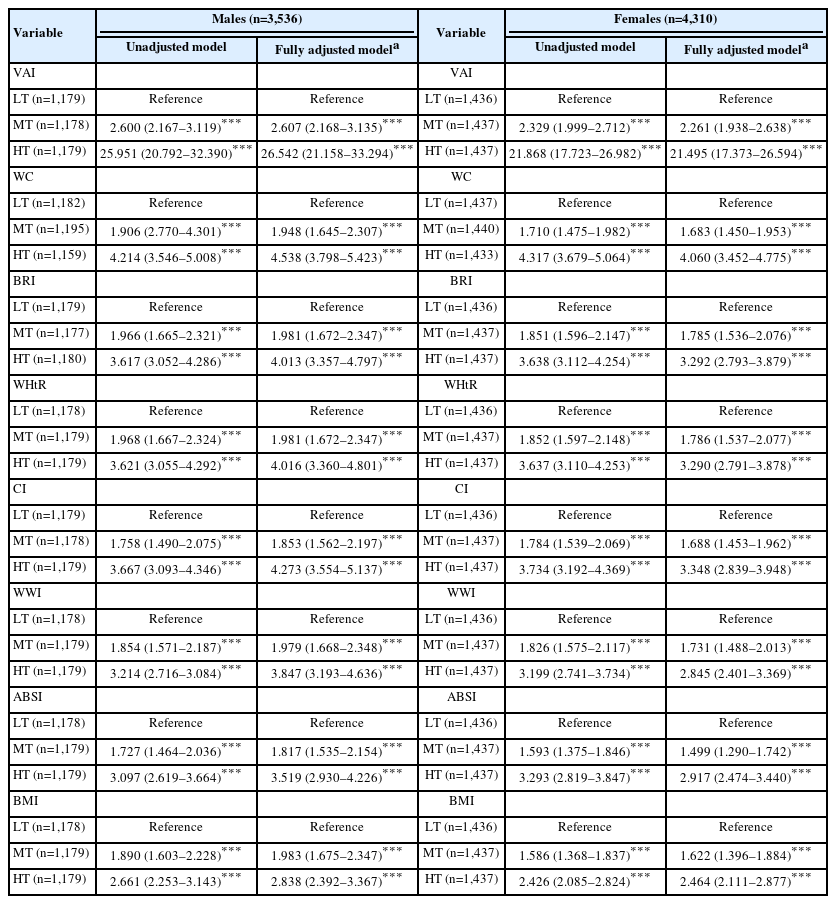
Table 3 presents the sex-specific ORs for the associations between body adiposity indices and MONW. Among males, in the fully adjusted models, the VAI had ORs of 2.607 (2.168–3.135) for the middle tertile and 26.542 (21.158–33.294) for the highest tertile (P<0.001 for both). For WC, the ORs were 1.948 (1.645–2.307) and 4.538 (3.798–5.423) for the middle and highest tertiles, respectively (P<0.001 for both). The BRI yielded ORs of 1.981 (1.672–2.347) and 4.013 (3.357–4.797), whereas the WHtR presented nearly identical values, with ORs of 1.981 (1.672–2.347) and 4.016 (3.360–4.801) (P<0.001 for all). For the CI, the ORs were 1.853 (1.562–2.197) and 4.273 (3.554–5.137); for the WWI, they were 1.979 (1.668–2.348) and 3.847 (3.193–4.636); for the ABSI, they were 1.817 (1.535–2.154) and 3.519 (2.930–4.226); and for the BMI, they were 1.983 (1.675–2.347) and 2.838 (2.392–3.367) (P<0.001 for all).
Among females, in the fully adjusted models, the VAI demonstrated ORs of 2.261 (1.938–2.638) for the middle tertile and 21.495 (17.373–26.594) for the highest tertile (P<0.001 for both). For WC, the ORs were 1.683 (1.450–1.953) and 4.060 (3.452–4.775), respectively (P<0.001 for both). The BRI had ORs of 1.785 (1.536–2.076) and 3.292 (2.793–3.879), whereas the WHtR yielded similar values: 1.786 (1.537–2.077) and 3.290 (2.791–3.878) (P<0.001 for all). For the CI, the ORs were 1.688 (1.453–1.962) and 3.348 (2.839–3.948); for the WWI, they were 1.731 (1.488–2.013) and 2.845 (2.401–3.369); for the ABSI, they were 1.499 (1.290–1.742) and 2.917 (2.474–3.440); and for the BMI, they were 1.622 (1.396–1.884) and 2.464 (2.111–2.877) (P<0.001 for all).
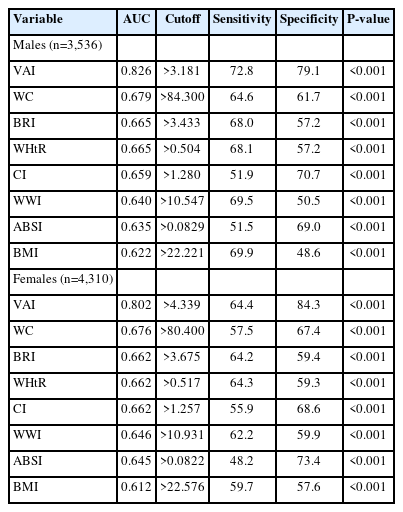
Table 4 presents the comparison of sex-specific ROC curves for body adiposity indices in identifying MONW. Among males, the VAI had the highest AUC of 0.826 (cutoff point: >3.181, sensitivity: 72.8, specificity: 79.1) (P<0.001). WC had an AUC of 0.679 (cutoff point: >84.300, sensitivity: 64.6, and specificity: 61.7) (P<0.001). Two indices, BRI and WHtR, demonstrated the same AUC of 0.665, with similar sensitivities (68.0 for BRI and 68.1 for WHtR) and the same specificity (57.2 for both) (P<0.001 for both). The CI, WWI, and ABSI exhibited progressively lower AUCs in descending order, with varying sensitivities (51.9 for CI, 69.5 for WWI, and 51.5 for ABSI) and specificities (70.7 for CI, 50.5 for WWI, and 69.0 for ABSI) (P<0.001 for all). BMI had the lowest AUC of 0.622 (cutoff point: >22.221, sensitivity: 69.9, specificity: 48.6) (P<0.001).
Similarly, among females, the VAI had the highest AUC at 0.802 (cutoff point: >4.339, sensitivity: 64.4, specificity: 84.3) (P<0.001). WC followed, with an AUC of 0.676 (cutoff point: >80.400, sensitivity: 57.5, specificity: 67.4) (P<0.001). Three indices, BRI, WHtR, and CI, had the same AUC of 0.662, with varying sensitivities (64.2 for BRI, 64.3 for WHtR, and 55.9 for CI) and specificities (59.4 for BRI, 59.3 for WHtR, and 68.6 for CI) (P<0.001 for all). The WWI and ABSI yielded similar AUCs of 0.646 and 0.645, respectively, with different sensitivities (62.2 for WWI and 48.2 for ABSI) and specificities (59.9 for WWI and 73.4 for ABSI) (P<0.001 for both). BMI had the lowest AUC at 0.612 (cutoff point: >22.576, sensitivity: 59.7, specificity: 57.6) (P<0.001).
DISCUSSION
This cross-sectional study examined the associations between various WC-based body adiposity indices and MONW in older Korean adults and compared their discriminative ability. The major findings can be summarized as follows: (1) All WC-based body adiposity indices were associated with MONW in both sexes; however, only the VAI demonstrated a stronger association than WC did. (2) Although all indices could identify MONW in both sexes, only VAI outperformed WC in terms of discriminative ability, whereas the other indices showed inferior performance. These findings suggest that the VAI may serve as the most effective indicator for identifying MONW among older Korean adults that are not underweight or obese.
Ruderman and colleagues [21] first introduced the concept of MONW, which is a subset of individuals with a BMI <25 kg/m2 who exhibit hyperinsulinemia, insulin resistance, and other metabolic abnormalities typically observed in obese individuals. Later, in 1998, they further confirmed that MONW individuals are relatively common and face an elevated risk for type 2 diabetes and cardiovascular disease [22]. Following their foundational work, a growing body of research has demonstrated various health concerns associated with MONW in Asian older adults [23-25]. Despite such health risks associated with MONW, the need for a universally applicable identification index has long been overlooked in public health.
In the present study, the VAI had the strongest association and the highest discriminative ability for identifying MONW in both sexes. Prior to the present study, several previous studies have shown that the VAI is effective at detecting metabolic abnormalities. For example, a cross-sectional study by Motamed et al. [26] indicated that the VAI was more closely related to MS than other indices, such as WC, BMI, WHR, and WHtR, in both sexes. Compared with other indices, the VAI has also demonstrated a superior ability to discriminate MS [26]. Additionally, a longitudinal study by Kang et al. [27] revealed that individuals in the highest tertiles of the VAI presented a 2.26-fold greater risk for males and a 1.75-fold greater risk for females in terms of progression from a metabolically healthy status to a metabolically unhealthy status. The VAI also exhibited greater discriminative ability than WC did, regardless of sex [27].
Although direct comparisons between these previous studies and the current study are limited by differences in participant characteristics, such as ethnicity, age, and BMI ranges, the previous findings collectively support the utility of the VAI as a sex-independent indicator for identifying and predicting metabolic abnormalities [13]. This usefulness may be derived from the incorporation of both anthropometric (WC and BMI) and metabolic (triglyceride and HDL cholesterol) parameters in the VAI. This combination allows for a more comprehensive reflection of visceral adiposity accumulation and dysfunction than does WC alone [13]. However, it is important to note that the VAI includes triglyceride and HDL cholesterol, which are also part of the operational definition of MONW. This overlap may lead to inflated observed associations and AUC values, limiting the interpretation of the VAI as a fully independent screening tool for metabolic risk.
In contrast, although the BRI, WHtR, CI, WWI, and ABSI were developed to improve assessments of abdominal obesity compared with WC or BMI, their associations with MONW and their discriminative abilities in older adults are relatively modest [12,14-16]. One possible explanation is that although these indices are helpful for general obesity screening, they may not adequately reflect the complex relationship between visceral fat and metabolic abnormalities in older adults. This is particularly relevant given that older individuals undergo physiological changes such as fat redistribution and loss of muscle mass, which complicate the obesity phenotype [28].
A key strength of this study is the extensive adjustment for demographic and lifestyle variables, enhancing the reliability of the associations observed. However, owing to the cross-sectional design, causality cannot be inferred. Longitudinal studies are needed to confirm these findings. Additionally, the inclusion criterion of BMI between 18.5 and 24.9 kg/m2, while consistent with standard definitions of normal weight, may not accurately reflect true adiposity or metabolic risk in older adults. Age-related physiological changes, such as sarcopenia and fat redistribution, are not captured by BMI alone and may have influenced the classification of MONW individuals in this population. Furthermore, since all participants were older Korean adults, it remains uncertain whether the results can be extrapolated to individuals of other ethnicities or in different countries. Measurements such as WC and WC-based indices used in this study are known to vary by ethnicity, age, and sex, highlighting the need for ethnicity-specific cutoff points. Finally, although MONW was defined using both MS criteria and the TyG index to improve sensitivity, their partial overlap, particularly concerning glucose and triglyceride components, may introduce redundancy. The TyG-based cutoff values, which were derived from a Korean sample, also require external validation before being applied more broadly.
In conclusion, our findings suggest that, compared with WC and other indices, the VAI may be the most effective WC-based index for identifying MONW in older adults that are not underweight or obese. Considering the limitations of BMI, WC, and other indices in capturing metabolic abnormalities, the VAI may serve as a more practical and accurate indicator for clinical screening and public health surveillance.
Notes
AUTHOR CONTRIBUTIONS
Dr. Bokun KIM had full access to all of the data in the study and takes responsibility for the integrity of the data and the accuracy of the data analysis. The author reviewed this manuscript and agreed to individual contributions.
Conceptualization, data curation, formal analysis, methodology, validation, writing original draft, reviewing & editing: BK.
CONFLICTS OF INTEREST
No existing or potential conflict of interest relevant to this article was reported.
FUNDING
This study was supported by the National Research Foundation of Korea grant funded by the Ministry of Education (No. NRF-2024S1A5B5A16020875).
DATA AVAILABILITY
Publicly available datasets were analyzed in this study. These data can be found here: The datasets generated during the current study are available in the 2014–2022 KHANES (https://knhanes.kdca.go.kr/knhanes/main.do) and analyzed during the current study are available from the corresponding author upon reasonable request.