Social Determinants of Health in Access to Repeat Kidney Transplantation
Article information

Abstract
Background
The longevity of transplanted kidney grafts is limited, and more than half of kidney transplant patients need repeat transplants during their lifetimes. However, inequity in access to repeat kidney transplants, especially that resulting from social determinants of health, has not been studied.
Methods
Using national data, this retrospective study analyzed kidney transplant recipients with failed kidney grafts (n=63,635) between October 1, 1987, and August 31, 2015, in the United States.
Results
After controlling the clinical covariates (i.e., primary disease, panel reactive antibody), age, race, education level, insurance type, and job status significantly impacted access to the kidney transplant waiting list after kidney graft failure. Higher odds of waiting-list access were evident among patients who were younger, White, and fully employed and who had private insurance and a college degree. A Cox proportional hazard model indicated that age, race, and insurance type impacted how long patients waited until being listed. Compared with patients younger than 71 years, those 71 years or older had a shorter duration until being wait-listed, with a hazard ratio (HR) of 1.84 (95% confidence interval [CI], 1.369–2.463; P<0.001). By contrast, Black patients waited longer to be wait-listed compared with White patients, with an HR of 0.75 (95% CI, 0.704–0.803; P<0.001). Moreover, of all insurance types, patients with public insurance (Medicare) experienced the longest duration to being re-listed.
Conclusions
Efforts to alleviate the impact of social determinants of health should start earlier following the initial transplant. Improving access to repeat kidney transplants will build transparency and trust in our transplant community, ultimately helping to achieve the best health outcomes.
INTRODUCTION
Inequity in access to limited health resources, including donated kidneys is undeniable. The chances of receiving a kidney transplant (KT) are deeply rooted in social determinants of health (SDOH) [1] or the conditions in the environments where people are born, live, learn, work, play, worship, and age. For example, the reduced probabilities of getting KT are associated with minoritized race [2], female sex [3], poverty [4], and low health literacy [1]. The longevity of transplanted kidneys is limited to a median of 11–19 years, depending on whether they receive the KT from a deceased or living donor; thus, given the relatively young ages (30–50 years old) of KT recipients at the time of the first KT surgery, the majority outlive their kidney grafts [5].
Although repeat KT is associated with superior survival benefits compared with returning to dialysis therapy [6], inequities persist in access to repeat KT among patients who have not yet experienced kidney graft failure [7]. Patients who experience graft failure and return to dialysis are predominantly managed by local nephrology groups, leading to reduced comprehensive follow-up from transplant programs, and data regarding their equitable access to transplant waitlists is limited. Our study analyzed data from the national transplant registry to investigate the influence of SDOH on access to repeat KT subsequent to the loss of a transplanted kidney.
METHODS
Design and sample
This retrospective and observational study used data from the Scientific Registry of Transplant Recipients (SRTR). The SRTR data system includes data on all donors, wait-listed candidates, and transplant recipients in the US submitted by members of the Organ Procurement and Transplantation Network (OPTN). The Health Resources and Services Administration of the US Department of Health and Human Services oversees the activities of the OPTN and SRTR contractors.
The analyzed data included kidney-only transplant patients (n=63,635) who were at least 18 years old and underwent a deceased- or living-donor KT between October 1, 1987, and August 31, 2015 (Fig. 1). We excluded transplant recipients who also received other organs, such as a liver, lung, or heart, because their transplant priority was based on the severity and acuity of clinical conditions. Moreover, to focus on KTs only, we excluded simultaneous KT and pancreas transplant patients. We also excluded those who died after the first KT and did not receive a repeat KT.
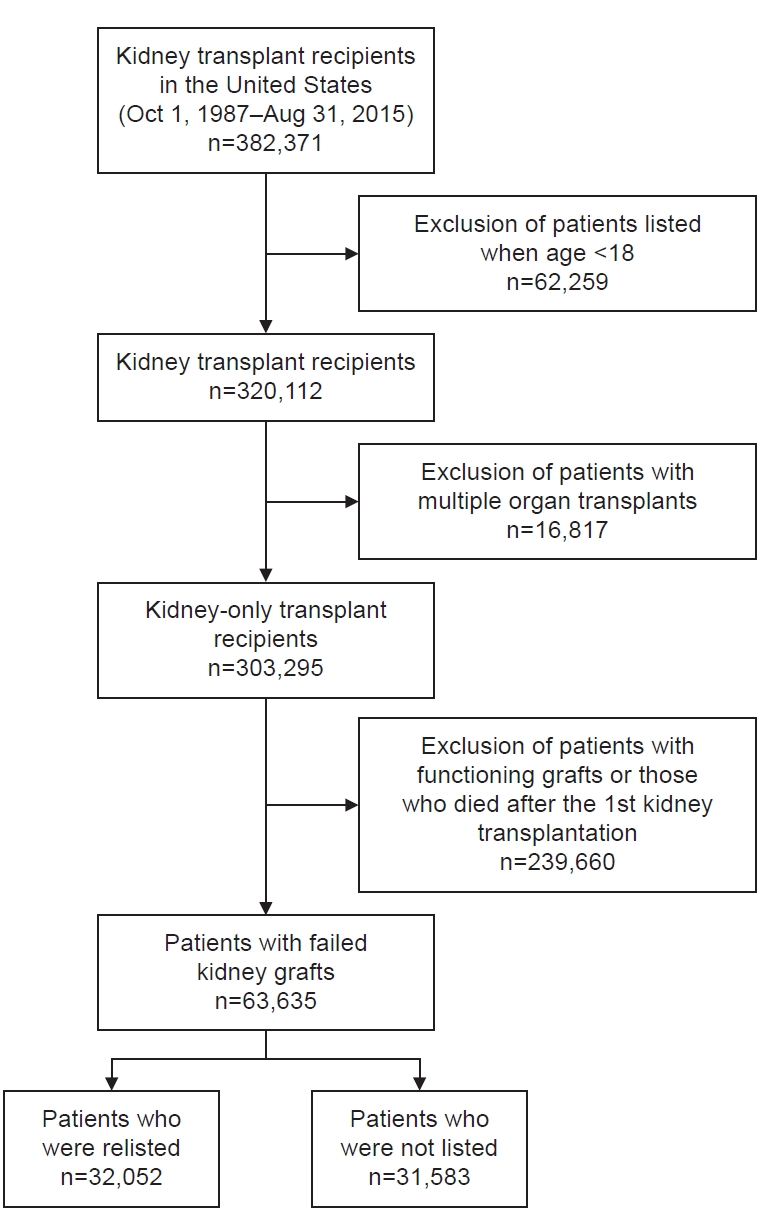
Flow diagram for study eligibility.
Measures and analyses
The independent variables of this study were the patients’ clinical characteristics (primary cause of graft failure, panel reactive antibody [PRA]) of the KT recipients and variables related to SDOH: age, sex, race/ethnicity, employment status, educational attainment, and primary health insurance coverage. The outcomes of this study were (1) access to repeat kidney transplantation, determined by the presence of a re-listed date in the dataset, and (2) the duration between kidney graft failure and being added to the waiting list for a repeat KT (re-listing).
All variables were described as counts and proportions with cross-tabulation. Continuous variables were reported with the median and interquartile range (IQR) and categorized into clinically relevant strata by generating another variable to organize and summarize the clinical characteristics of the study subjects. Logistic regression analysis was used to estimate the effect of individual predictors on access to the waiting list after kidney graft failure. The Kaplan-Meier method and log-rank test were used to examine, according to the risk factors, the statistical significance of the differences in the recipients’ time until re-listing after graft loss. Multivariate Cox proportional hazard regression was used to estimate the proportional hazards of the time to re-listing associated with the SDOH. All analyses were performed using R Statistical Software [8].
The data reported here were supplied by the Hennepin Healthcare Research Institute as the contractor for the SRTR. The interpretation and reporting of these data are the responsibility of the author(s) and should in no way be seen as an official policy of or interpretation by the SRTR or the US Government. In light of its use of secondary data, this study was subject to Institutional Review Board exemption of Rush University.
RESULTS
Baseline characteristics
From October 1, 1987, until August 18, 2015, a total of 63,635 patients experienced failed transplanted kidneys (Table 1). Among those with failed kidney grafts, 32,052 (50.4%) were wait-listed for repeat KT, of whom 7,162 were pre-emptively wait-listed and 24,890 were wait-listed after kidney graft failure.
Proportion of patients with graft failure and adjusted odds for being relisted for kidney transplantation
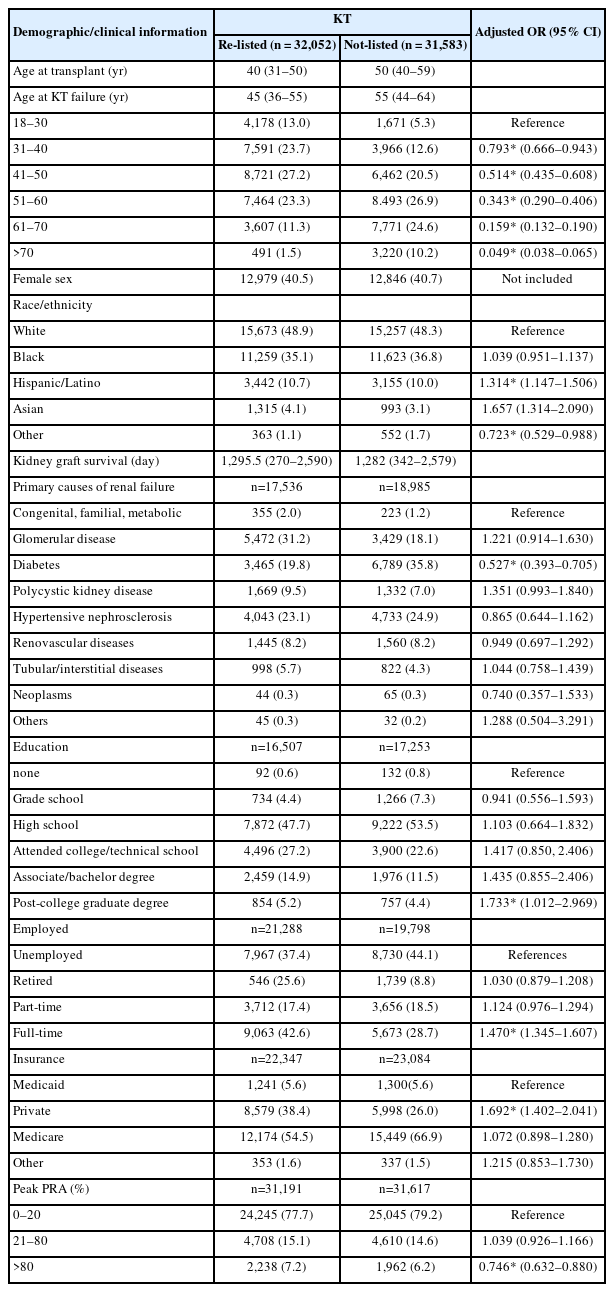
Table 1 presents the demographic and clinical characteristics of the patients and the adjusted odd ratios for the likelihood of being wait-listed according to the patient characteristics. For those who were re-listed, the median age at the time of kidney graft failure was 45 years (IQR=36–55 years). By contrast, those who were not re-listed had a median age of 55 years (IQR=44–64 years). The median duration of kidney graft survival was 1,282 days for patients who were not re-listed (IQR=342–2,579 days) and 1,295.5 days for re-listed patients (IQR=270–2,590 days).
The groups had similar proportions of female patients (40.5% [re-listed] vs. 40.7% [non-listed]). The majority of patients in both groups were White (48.9% [re-listed] vs. 48.3% [non-listed]) or Black (35.1% [re-listed] vs. 36.8% [non-listed]). The highest education level attained was a high school degree for approximately half of the participants (47.7% [re-listed] vs. 53.5% [non-listed]). For those who were re-listed, 9,063 patients (42.6%) were full-time employees, whereas 5,673 (28.7%) of those who were not re-listed were working full-time. Medicare was the most common insurance type for both groups (54.5% [re-listed] vs. 66.9% [non-listed]), followed by private insurance (38.4% vs. 26.0%).
For those who were re-listed, hypertension was the most prevalent primary cause of kidney failure, followed by diabetes. Diabetes was the most common cause of kidney failure for those who were not re-listed. Peak PRA was greater than 80% for 2,238 re-listed patients and 1,962 patients who were not re-listed.
Impacts of social determinants of health on access to the waitlist
After controlling the clinical covariates (i.e., primary disease, PRA), age, race, education level, insurance type, and job status significantly impacted access to the KT waiting list after kidney graft failure. The plots in Fig. 2 indicate how the SDOH variables affected access to the waiting list. Higher odds of waiting-list access were evident among patients who were younger, White, employed full-time, and had private insurance and a college degree. This model fits the data well, as proven by the Hosmer-Lemeshow goodness-of-fit test and chi-squared test (2.572, degree of freedom=8, P=0.958).
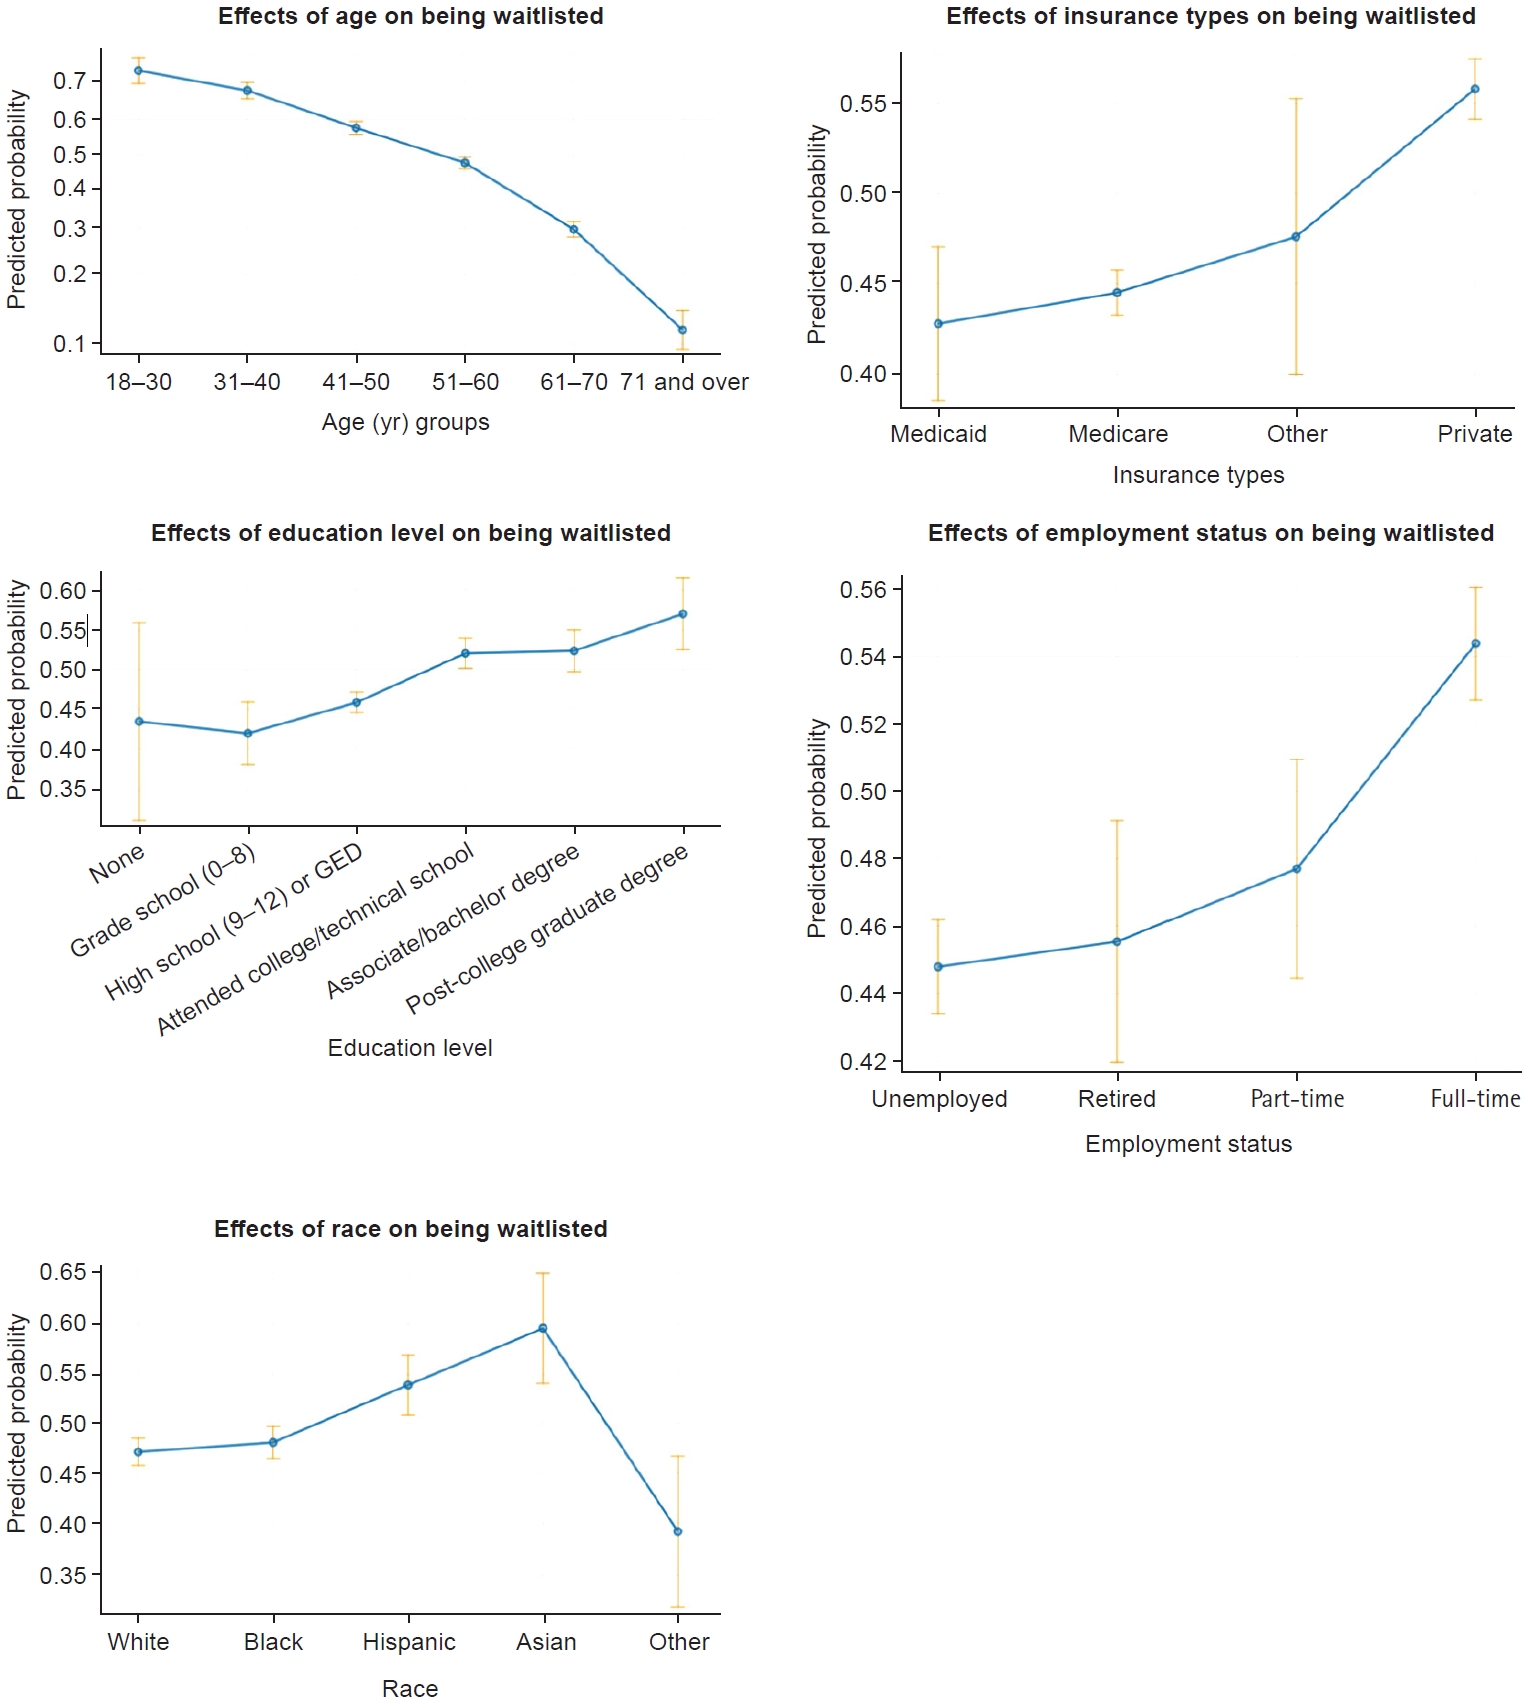
Effects of social determinants of health on access to repeat kidney transplantation. GED, general educational development.
The multivariate Cox proportional hazard model indicated that age, race, and insurance type impacted the duration until being re-listed (Fig. 3). For example, patients at least 71 years old experienced a relatively short duration until being wait-listed compared with those younger than 71 years, with a hazard ratio (HR) of 1.84 (95% CI, 1.369–2.463; P<0.001). Black patients also waited longer to be wait-listed compared with White patients with an HR of 0.75 (95% CI, 0.704–0.803; P<0.001). Moreover, compared with all other insurance types, the patients with Medicare waited the longest to be wait-listed (95% CI, 0.758–0.982; P<0.001).
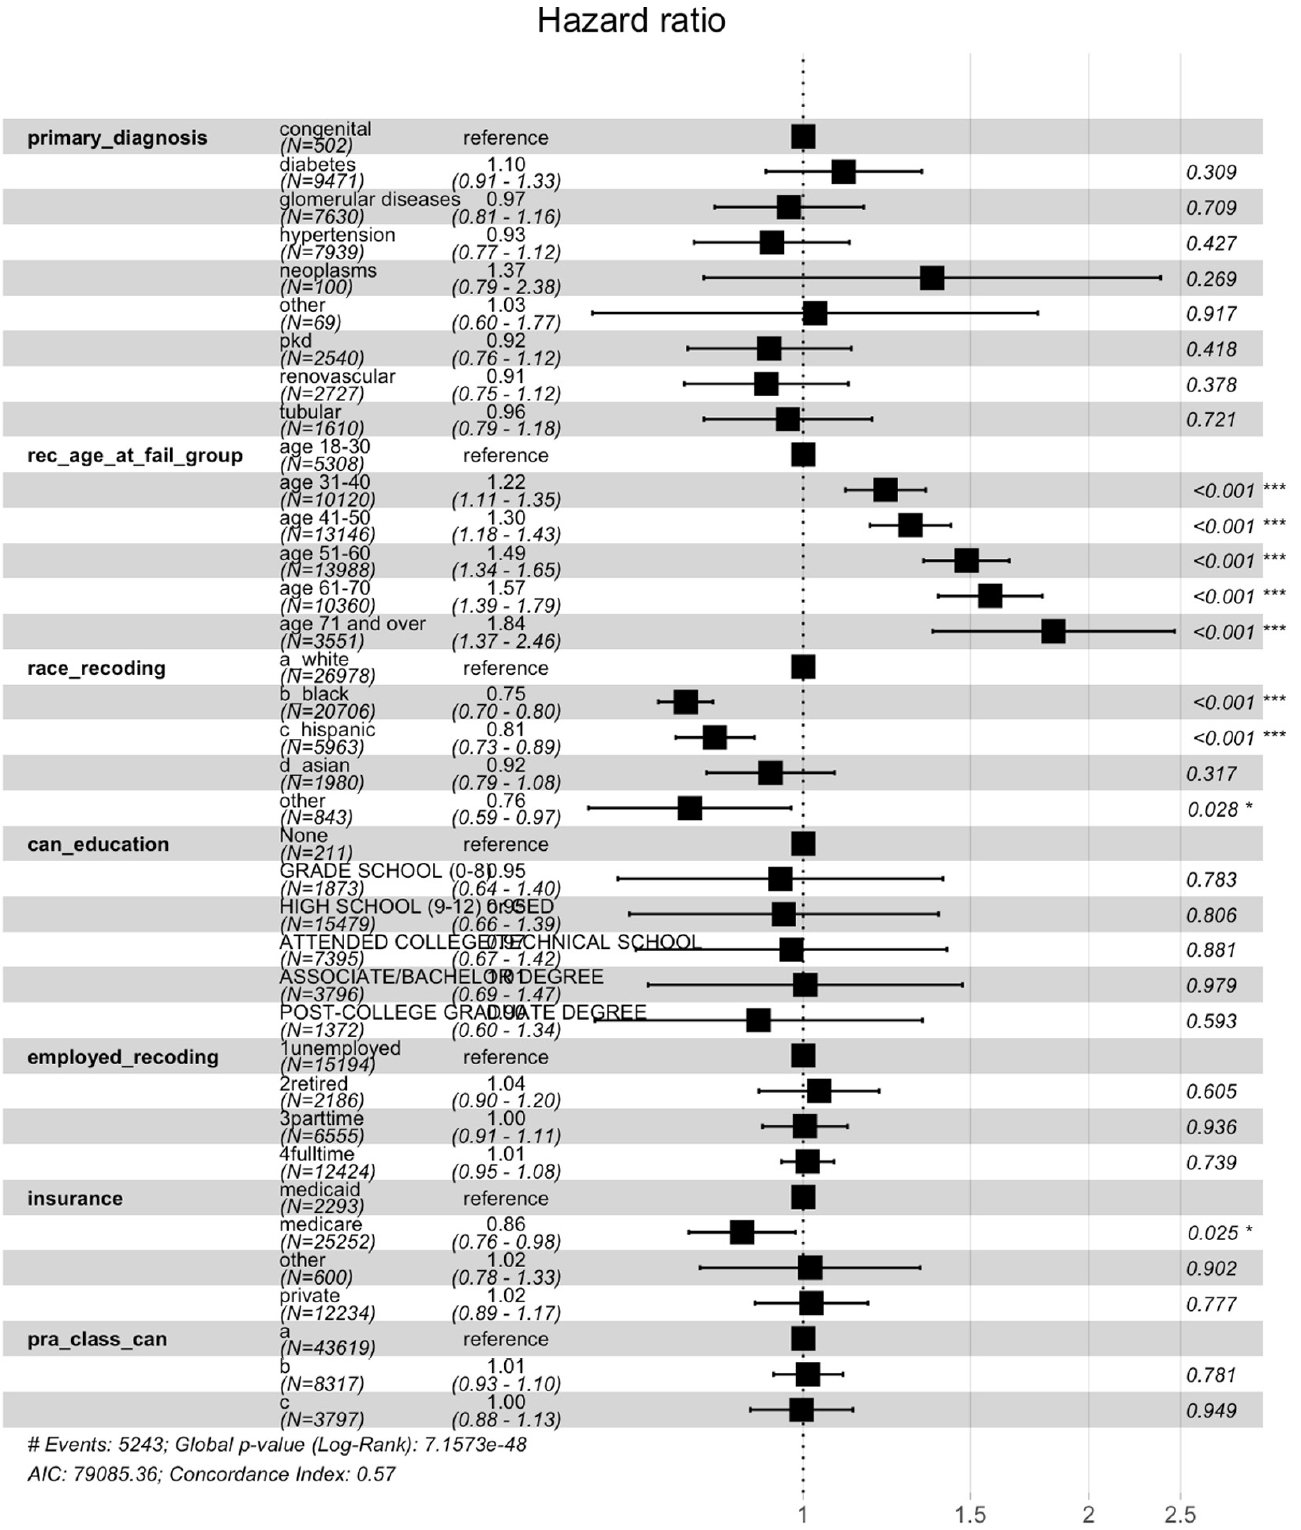
The proportional hazards of the time to re-listing associated with the social determinants of health. Asterisk indicates a statistically significant (*P<0.05, ***P<0.001).
DISCUSSION
Our findings show that patients with certain characteristics corresponding to SDOH—advanced age, minoritized race, lower education level, unemployed status, and public insurance—had limited access to repeat KT. Notably, the duration until being wait-listed was prolonged for Black patients. One interesting finding of our study is that the duration until being wait-listed was relatively shorter for the older group, although their odds of being wait-listed were low. When an older patient is deemed a candidate for repeat KT, the transplant program likely expedites the work-up process before the patient becomes older and experiences frailty.
Equitable access to KT is an ultimate goal in the transplant community [9], and SDOH are known barriers to KT access. For example, gender and race/ethnicity are the most well-known factors associated with limited access to KT [10,11]. Compared with White patients, Black patients tend to experience lower referral rates [3,12], more incomplete transplant evaluations [13-15], and a prolonged evaluation process [16] and are therefore less likely to undergo KT. Black families are also less likely to be invited to discuss organ donation compared with White families [17]. Moreover, White candidates are pre-emptively listed for KT more often than candidates of other race/ethnicity groups [18], and it takes longer for Hispanic patients to be placed on the waiting list [19]. One study found that individuals with kidney failure in other race/ethnicity groups, such as American Indian/Alaska Native individuals and Pacific Islanders, had lower deceased-donor KT rates compared with White and Asian individuals [20]. Geriatric patients with kidney failure are less likely to have discussions with healthcare providers about KT as a potential treatment option [21]. Low health literacy has also shown a correlation with limited access to KT from any donor type [22], and employment status is strongly associated with KT access, with unemployed and partially employed patients at a disadvantage [6]. Furthermore, patients insured with Medicaid have shown a lower probability of receiving a living-donor KT and a higher probability of being removed from the waiting list compared with privately insured patients [23]. Studies have also shown that patients with higher socioeconomic status had better access to organ transplants than those with the lowest socioeconomic status [24,25].
Transplanted kidneys are not long-lasting. In contrast to the excellent short-term survival outcomes of transplanted kidneys, the long-term survival outcomes are disappointingly poor. One out of every five KT patients either returns to dialysis or undergoes a repeat KT [5]. Fortunately, repeat KTs have been shown to increase the survival rate compared with returning to dialysis after kidney graft failure [26] and more than half of patients who lose a kidney graft are eventually wait-listed for repeat KT [7].
As our study shows, there are several potential explanations for persistent inequity in access to repeat KT. Given the relatively high risk of rejection [27] and severe infection [28], transplant centers may implement more conservative candidate screening after the first KT. After the first KT, patients may have increased social needs that may be unmet due to unemployment resulting from health conditions, loss of insurance, and financial burdens.
Our study suggests that after KT, patients should be consistently educated on the realistic long-term outcomes of transplanted kidneys so they can be wait-listed before kidney graft failure and before reaching a more advanced age. Our study highlighted the impact of several SDOH, such as sex, race/ethnicity, employment status, educational attainment, and access to health insurance, many of which are beyond an individual’s direct control. Consequently, we highly recommend that the transplant community adopt a systematic approach to mitigating the impacts of SDOH throughout the progression of kidney disease. For example, transplant programs designed specifically for African American, Latino, or Asian populations can cultivate trust and engagement within minority racial/ethnic groups and offer support to help non–English-speaking patients overcome language barriers. Tailored educational materials that address the complexities of the transplant process can enhance understanding of the benefits and risks associated with transplant surgeries among patients with limited health literacy, enabling such patients to make informed decisions. Additionally, the provision of social support and resources by health care professionals, such as social workers, can assist patients in securing employment and navigating complex health insurance policies, ensuring that patients have access to adequate insurance coverage.
Our study has notable limitations. Given its retrospective nature, we cannot show the causal effects of SDOH on waiting list access. The currently available dataset for the organ transplant community provides very limited information about SDOH. For example, our data lacked information on birthplace, zip code, marital status, family support system, poverty and income level, health literacy, food security, job security, access to healthcare, distance to a transplant center, and neighborhood segregation. When cleaning the dataset, we did not differentiate candidates for living-donor KT from those for deceased-donor KT. However, some transplant recipients may have undergone a living-donor KT without ever joining the waiting list.
To our knowledge, and despite these limitations, this study is the first to examine the impacts of SDOH on access to the waiting list for repeat KT and the duration until wait-listing after kidney graft failure. For patients with advanced chronic kidney diseases and kidney failure, KT is the optimal alternative to dialysis therapy, affording patients a return to normalcy and an improved quality of life [29,30]. However, donated kidneys are a scarce health resource and are ultimately not available to all kidney failure patients, especially those with unmet social needs. Improving access to kidney transplantation will build trust and transparency in our transplant community and help to achieve the best health outcomes.
Notes
AUTHOR CONTRIBUTIONS
Dr. Jongwon YOO had full access to all of the data in the study and takes responsibility for the integrity of the data and the accuracy of the data analysis. Author reviewed this manuscript and agreed to individual contributions.
Conceptualization, Data curation, Formal analysis, Investigation, Methodology, Resources, Software, Validation, Visualization, Writing–original draft, Writing–review & editing: JY.
CONFLICTS OF INTEREST
No existing or potential conflict of interest relevant to this article was reported.
FUNDING
None.
DATA AVAILABILITY
The data presented in this study are available upon reasonable request from the corresponding author.