Factors Affecting Perceived Stress-Cortisol Responses in Young Adults
Article information

Abstract
Background
This study examined the distribution of stress-cortisol responses and risk factors affecting perceived stress and cortisol responses among 187 university students in South Korea.
Methods
Perceived stress, depressive symptoms, and health-promoting lifestyle were assessed using structured questionnaires. Blood analyses and anthropometrics were used to determine cortisol and cardiometabolic risks. Multinomial logistic regression analysis was used to examine the factors affecting stress-cortisol responses.
Results
Four groups of stress-cortisol responses were found, including normal (39.0%), high stress (34.8%), high stress-cortisol (13.9%), and high cortisol group (12.3%). Age, systolic blood pressure, high-density lipoprotein cholesterol, depressive symptoms, and physical activity were associated with stress-cortisol responses.
Conclusions
Multidimensional interventions are needed to reduce stress levels and promote normal stress-cortisol responses.
INTRODUCTION
University students experience acute and chronic stress during their developmental transition to adulthood [1,2], including academic pressure, peer influence, financial concerns, time management, and interpersonal relationships [3-6]. Stress during college or early adulthood has been linked to physical and mental health problems [7-9].
One response to stress is the secretion of cortisol from the adrenal cortex at the end of the hypothalamic-pituitary-adrenal (HPA) axis, the pathway of the stress-hypothalamus-pituitary-adrenal cortex. This pathway is a major stress response system that maintains homeostasis during stress [10,11]. Cortisol is a major steroid hormone essential for human survival and a well-known key indicator of stress [12]. The results of previous studies on stress-cortisol responses have been inconsistent, and it remains unclear how cortisol responds to stress in different situations [13,14]. In light of the results from previous studies that stress-cortisol responses appear differently depending on physical, psychological, and lifestyle factors, this study considered how these factors may affect stress-cortisol responses among university students.
Background
Cardiometabolic risks can lead to cardiovascular diseases and type 2 diabetes [15]. Increased stress and cortisol levels are significantly linked to cardiometabolic risk factors for cardiovascular diseases and metabolic syndrome. Dysregulation of the HPA axis increases cortisol levels in the blood, resulting in increased glucose and insulin levels, the emergence of insulin resistance, and the promotion of dyslipidemia, hypertension, and visceral adiposity [10,16-18]. While cardiometabolic risks may be related to stress-cortisol responses in university students, scarce information exists on the relationship between stress-cortisol responses and cardiometabolic risks among university students.
Depressive symptoms are the predominant mental health problem among university students, where about 30% to 40% experience depressive symptoms [19], and the prevalence of depressive symptoms are increasing [20]. Stress is a well-known risk factor for depressive symptoms [7,21], which predicts steeper cortisol reactivity and recovery [22]. Several studies on the relationships between cortisol levels, perceived stress, and depressive symptoms have used hair or salivary cortisol [23,24]. However, few studies have discussed the relationship between stress-cortisol responses and depressive symptoms among university students using plasma cortisol.
Stress-cortisol responses might differ depending on individuals’ health-related lifestyle behaviors. For example, young adults, transitioning to university life, often adopt unhealthy habits [25] such as poor dietary choices [26-28], alcohol consumption, and smoking [29,30]. These maladaptive health behaviors in young adults are related to stress [31]. Moreover, psychological stress was associated with healthy lifestyle behaviors among university students [32,33]. However, little is known about the association between stress-cortisol responses and healthy lifestyle behaviors, such as health responsibility, physical activity, nutrition, stress management, interpersonal relationships, and spiritual growth.
While stress and its health implications garner scientific interest, most studies on stress-cortisol responses have focused on acute stress based on laboratory stimuli [13] and primarily focused on the linear relationship between stress and cortisol. It is essential to capture the subtle interplay more accurately between stress and cortisol responses. To enhance specificity, therefore, this study examined (a) the distribution of perceived stress and cortisol responses among university students, and (b) physical (cardiometabolic risks), psychological (depressive symptoms), and lifestyle (health-promoting lifestyle behaviors) factors affecting stress-cortisol responses (Fig. 1).

Conceptual framework of this study.
METHODS
Design
This study was a secondary analysis of survey data conducted during the general health check-up for Korean college students.
Sample and setting
The setting was the Ajou University Hospital in Suwon, South Korea. Recruitment of participants occurred through a notice posted on a university healthcare center bulletin board from March 2015 to February 2017 [2]. Participants were instructed to avoid consuming caffeine, alcohol, or dairy products after 7 PM on the day before cortisol sampling. Clinical laboratory measurements and questionnaires were used to collect the data. Using the G*Power version 3.1.9.7 (Heinrich Heine University, Düsseldorf, Germany), a sample size of 208 was required based on a medium effect size (odds ratio=1.5) and a power of 80% using 95% confidence interval (CI) tests for logistic regression analysis. Among the 208 eligible students, data from 187 students were included in the analyses. Twenty-one individuals who had been prescribed medications to lose weight and those with chronic morbidity or major depression were excluded.
Measures
Stress (subjective and objective)
Perceived stress
The 10-item Perceived Stress Scale (PSS) [34] was used to assess the global level of stressful life situations and circumstances during the past month. The PSS measures the degree to which respondents find their lives overwhelming, uncontrollable, and unpredictable by asking them to respond on a 5-point Likert scale ranging from 0 (never) to 4 (very often), with higher scores indicating greater psychological stress. Total scores range from 0 to 40 and are calculated by summing the scores of all items. Items 4, 5, 7, and 8 are reverse scored. PSS scores >20 were considered as the high stress group. Cronbach’s alpha coefficient was 0.83.
Cortisol
Clinical laboratory measurement of afternoon cortisol was evaluated through ethylenediaminetetraacetic acid-plasma at the central laboratory of a university-affiliated hospital. Cortisol levels were assessed by electro-chemiluminescence immunoassay using an automatic analyzer (Toshiba TBA 200FR; Toshiba Medical Systems Co. Ltd., Tokyo, Japan). In this study, normal values of plasma cortisol were considered as 1.8–12.7 µg/dL.
Cardiometabolic risk
Cardiometabolic risk was assessed using blood sample analysis and anthropometrics. Overnight fasting blood samples were collected from the antecubital veins. Fasting plasma glucose (FPG) was assessed through the enzymatic reference method with hexokinase, and lipid profiles, including triglycerides (TGs) and high-density lipoprotein cholesterol (HDL-C), were assessed by enzymatic colorimetric assay using an automatic analyzer (COBAS C702 Auto Analyzer; Roche Diagnostics Systems Ltd., Basel, Switzerland). A trained nurse gauged waist circumference (WC) at the central position between the 12th rib and the iliac crest. Body mass index (BMI) was calculated as weight in kilograms divided by height in meters squared (kg/m2). Blood pressure (BP) was measured after a 5-minute rest in a sitting position using an automatic sphygmomanometer (HEM-7210; OMRON, Kyoto, Japan).
Depressive symptoms
Depressive symptoms were assessed using the Center for Epidemiologic Studies Depression Scale (CES-D) [35]. The CES-D is a self-report 20-item scale that asks respondents to rate how often, over the past week, they have experienced depressive symptoms such as restless sleep, poor appetite, and feeling lonely. Items are responded to using a 4-point Likert scale ranging from 0 (rarely or none) to 3 (most or all the time, 5–7 days). Total scores range from 0 to 60 and are generated by summing the scores of all items. Higher scores indicate higher levels of depressive symptoms. A CES-D cutoff score of 16 has been used to indicate significant depressive symptomatology [36]. Cronbach’s alpha coefficient was 0.90.
Health-promoting lifestyle behaviors
The Korean version of the Health Promoting Lifestyle Profile II (HPLP II) [37,38] was used to measure health-promoting lifestyle behaviors. The six subscales include interpersonal relationships, nutrition, health responsibility, physical activity, stress management, and spiritual growth. The HPLP II consists of 52 items with response options on a 4-point Likert scale ranging from 1 (never) to 4 (routinely). The total score is the mean of the responses to the 52 items, with a possible range of 1–4; higher scores indicate higher health-promoting lifestyle performance. Cronbach’s alpha coefficients ranged from 0.71 to 0.88 for the subscales and 0.94 for the total scale.
Sociodemographic factors
Sociodemographic factors (age, gender, education level, current smoking status, and drinking status) were collected using a self-administered questionnaire.
Ethical considerations
This study was approved by the Ajou University Hopistal Institutional Review Board (No. AJOUIRB-MDB-2021-016). All participants provided informed consent upon registration for a general health checkup at Ajou University Hospital and participants’ confidentiality was preserved.
Statistical analysis
Data were analyzed using IBM SPSS Statistics (ver. 22.0; IBM Corp.) and Stata/BE (ver. 17; StataCorp LLC). Descriptive analyses were performed using frequencies and percentages for categorical variables and means and standard deviations (SDs) for continuous variables. Participants were classified into one of four stress-cortisol response groups using cortisol levels (normal cortisol range: 1.8–12.7 µg/dL) and perceived stress scores (high levels of stress: PSS scores>20) as follows: normal group (PSS scores≤20, cortisol level<12.7 µg/dL), high stress-cortisol group (PSS scores>20, cortisol level≥12.7 µg/dL), high cortisol group (PSS scores≤20, cortisol level≥12.7 µg/dL), and high stress group (PSS scores>20, cortisol level<12.7 µg/dL). The cardiometabolic risks are considered as elevated WC (≥85 cm for women, ≥90 cm for men), elevated BP (≥130/85 mmHg), elevated TG (≥150 mg/dL), decreased HDL-C (≤50 mg/dL for women, ≤40 mg/dL for men), and elevated FPG (≥100 mg/dL). Pearson’s chi-square test, Fisher’s exact test, and Analysis of Variance (ANOVA) were used to examine bivariate associations between sociodemographic factors, cardiometabolic risks, depressive symptoms, health-promoting lifestyle behaviors, and stress-cortisol response groups. Post-hoc analyses with ANOVA were conducted using Bonferroni multiple-comparison tests. Multinomial logistic regression analysis was used to examine risk factors associated with the stress-cortisol responses. The strength of association was estimated using relative risk ratios (RRRs) and the 95% CI. All subcategories of the HPLP II were included in the multinomial logistic regression along with other variables with significant relationships at P<0.05 (alpha of 5%) in the bivariate analyses.
RESULTS
General characteristics
Table 1 presents the participants’ general, physical, psychological, and lifestyle characteristics. The mean age was 23.97 years (SD=3.38), and 54.0% of the participants were women. Approximately 70% of the participants were undergraduates; most were non-smokers (n=169, 90.4%) and did not drink alcohol (n=120, 64.2%). The mean score for perceived stress was 20.02 (SD=5.52), within a possible range of 0–40. The mean cortisol level was 10.81 µg/dL (SD=4.08). The numbers of participants in each cardiometabolic risk factor group were 45 (24.1%) with high BP, 33 (17.6%) with high WC, 17 (9.1%) with high TG, 5 (2.7%) with low HDL-C, and 7 (3.7%) with high FPG. The mean depressive symptom score was 19.10 (SD=9.36), within a range of 0–60, with 115 (61.5%) participants scoring 16 or higher. The lowest score on the HPLP II subscales was for physical activity (1.83/4.00).

General characteristics, depressive symptoms, cardiometabolic risks, and health-promoting lifestyle behaviors (N=187)
The distribution of stress-cortisol response groups
Fig. 2 shows the distribution of the stress-cortisol response groups. The results indicated 73 participants (39.0%) were in the normal group (PSS scores≤20, cortisol level<12.7 µg/dL), 26 (13.9%) were in the high stress-cortisol group (PSS scores>20, cortisol level≥12.7 µg/dL), 65 (34.8%) were identified as being in the high stress group (PSS scores>20, cortisol level<12.7 µg/dL), and 23 (12.3%) were in the high cortisol group (PSS scores≤20, cortisol level≥12.7 µg/dL).

Distribution of stress-cortisol response groups (N=187).
Univariate analysis across stress-cortisol response groups
Table 2 shows the results of the univariate analyses for the differences in the general characteristics according to stress-cortisol response groups. Among the sociodemographic variables, gender (P<0.001) was significantly associated with stress-cortisol response groups. Among the cardiometabolic risk factors, systolic blood pressure (SBP) (P<0.01), HDL-C (P=0.03), and BMI (P=0.02) were significantly associated with stress-cortisol response groups. Depressive symptoms were also significantly associated with stress-cortisol response groups (P<0.001). Significant associations were found between stress-cortisol response groups and four HPLP II subscales, including interpersonal relationships (P<0.001), nutrition (P<0.01), stress management (P<0.01), and spiritual growth (P<0.001).
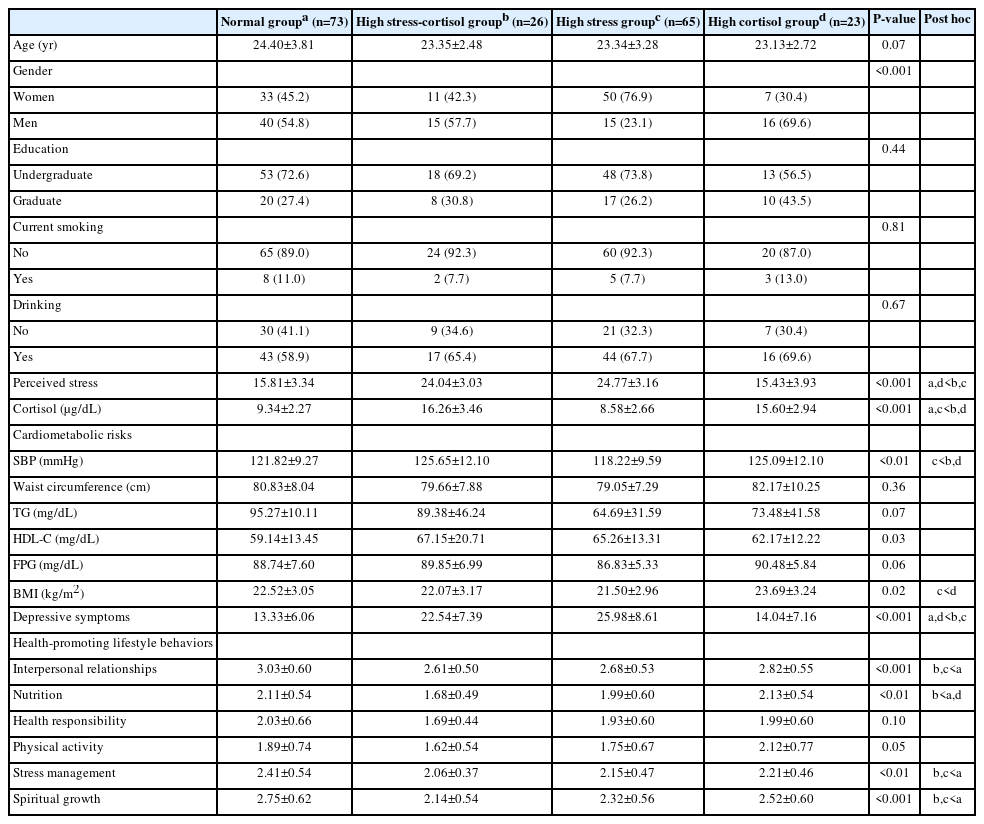
Univariate analyses across stress-cortisol response groups (N=187)
Risk factors for stress-cortisol response groups
The normal group, consisting of participants who exhibited normal ranges of perceived stress and cortisol, served as a reference group in the multinomial logistic regression analysis. Table 3 presents the risk factors associated with stress-cortisol responses based on the multinomial logistic regression analysis. Participants of higher ages were relatively less likely to belong to the high stress group (RRR 0.82, 95% CI 0.68–0.98) than to the normal group. Participants who were at risk of having depressive symptoms (RRR 1.33, 95% CI 1.21–1.47) were more likely to be in the high stress group. Participants who reported engaging in high levels of physical activity were relatively more likely to belong to the high cortisol group (RRR 3.49, 95% CI 1.20–10.11). In addition, individuals with higher SBP (RRR 1.07, 95% CI 1.00–1.14), higher HDL-C levels (RRR 1.06, 95% CI 1.01–1.10), and those at risk of experiencing depressive symptoms (RRR 1.28, 95% CI 1.15–1.42) were more likely to be categorized in the high stress-cortisol group compared to the normal group.
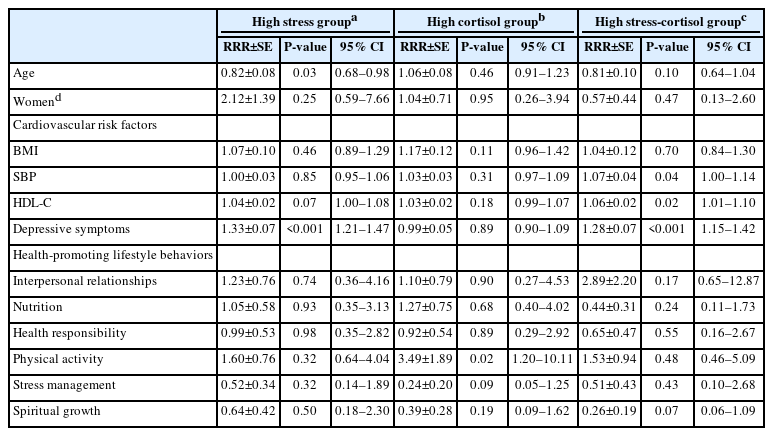
Multinomial logistic regression model across stress-cortisol response groups (N=187)
DISCUSSION
The present study investigated the distribution of four types of stress-cortisol responses and risk factors associated with stress-cortisol responses in university students. We found that age, cardiometabolic risk factors (e.g., SBP, HDL-C), depressive symptoms, and lifestyle factors (e.g., physical activity) predicted stress-cortisol responses to naturally occurring stress in university students.
We identified four groups: a normal group (39.0%), a high stress-cortisol group (13.9%), a high stress group (34.8%), and a high cortisol group (12.3%). Thus, over 60% of the participants were at risk of stress. Other studies have also explored the distribution of stress-cortisol response groups [39,40]. Dalile et al. [39] classified stress-cortisol responses into four classes: mild (11.5%), moderately low (34.2%), moderately high (35.9%), and hyper-responders (18.5%). Paananen et al. [40] identified three cortisol response patterns in young adults using the Trier Social Stress Test: an intermediate-responsive group (47% women, 54% men), a hyporesponsive group (34% women, 21% men), and a hyperresponsive group (18% women, 21% men). It should be noted that these studies [39,40] used trajectory modeling based on longitudinal data. However, our study identified stress-cortisol response groups based on normal cortisol levels and naturally accruing stress with no artificial stimuli. Nevertheless, all these results, including findings of this study, support the importance of monitoring stress-cortisol responses to promote health.
We found that participants with high SBP and HDL-C levels were more likely to belong to the high stress-cortisol group than to the normal group. High SBP and low HDL-C levels are well-known risk factors for cardiovascular diseases. The relationship between HPA axis activity and cardiometabolic diseases is well-documented [10,16-18]. In addition, stress elevates glucocorticoid output, which can cause elevated cholesterol and BP levels [18]. Prolonged exposure to stressful situations can increase the risk of cardiovascular diseases [41]. In the context of this study, experiencing naturally occurring stress, we can assume that university students who belong to the high stress-cortisol group may have repeated exposure to everyday stressors. This study indicates that special attention and early intervention are essential for this group.
In our study, the participants who showed high levels of depressive symptoms had a higher probability of belonging to the high stress and high stress-cortisol groups than to the normal group. This finding indicates that university students with high levels of depressive symptoms may experience high levels of psychological stress with varying cortisol levels; likewise, stress is a well-known risk factor for depressive symptoms [42]. Our findings align with previous studies linking stress-cortisol responses to depression [22,43]. These results indicate that depression is associated with higher stress levels.
Participants who reported high levels of physical activity were more likely to belong to the high cortisol group than to the normal group. Previous studies found that physical activity reduces perceived stress [44,45]. Unlike our result, a review of the literature revealed that physical exercise could have beneficial effects on lowering cortisol levels [46]. Further investigation is needed to determine whether physical activity itself is a stressor activating the HPA axis and whether cortisol level recovery to baseline is associated with physical activity.
Notably, among the sociodemographic factors in our study, there was a significant difference in the gender ratio among the stress-cortisol response groups although gender had no significant effect on those groups. The percentage of men students was much higher in the high cortisol group (69.6%) and high stress-cortisol group (57.7%), whereas the rate of women students was much higher in the high stress group (76.9%). A study found gender differences in perceived stress (higher levels of stress in women college students) and more utilization of emotion-focused coping strategies in women than men students [47]. These results imply that gender is a contributing factor in the experience of stress and therefore healthcare providers should consider gender when developing and implementing health promotion interventions.
The probability of being in the high stress group decreased with a one-year increase in age. This result is consistent with a previous study that reported higher levels of stress in younger students [48], suggesting that younger students need more support. However, it remains unclear whether aging is accompanied by changes in the HPA axis function [13]. Furthermore, all participants in this study were young adults aged 19–39 years, an age range that may be too narrow to consider the effects of age on stress-cortisol responses.
Contrary to expectations, BMI and aspects of health-promoting lifestyle behaviors, including interpersonal relationships, nutrition, health responsibility, stress management, and spiritual growth, did not emerge as significant contributors to stress-cortisol responses. Possible explanations for these non-significant findings may be rooted in the multifaceted nature of stress-cortisol interactions. It is conceivable that the influence of these factors is moderated by unexplored variables not accounted for in our study. Further exploration into the reasons for these outcomes is warranted.
The study’s findings suggest delivering customized health promotion interventions for university students, addressing the factors affecting stress-cortisol responses, and acknowledging the adverse impact of high stress and cortisol levels on health. According to a previous study, university students with low resilience showed higher scores in perceived stress [49]. Furthermore, mindfulness meditation was significantly effective in decreasing serum cortisol levels and perceived stress [50]. Therefore, providing programs focused on resilience and mindfulness meditation could be beneficial for students, particularly those who experience high stress.
Limitations
The participants in this study were limited to healthy university students recruited using convenience sampling at a single university in Korea. Thus, a limitation is the generalizability of the results to other student populations. Future research should use a larger and more diverse sample to improve generalizability. Furthermore, the present study employed a cross-sectional design and therefore could not investigate the potential fluctuations and trajectories of cortisol responses to stress. Studies using a longitudinal design are required to better understand these relationships.
Notes
AUTHOR CONTRIBUTIONS
Conceptualization: SS, CJK, and HSK. Data curation: SS and CJK. Formal analysis: SS, CJK, and HSK. Investigation: CJK. Resources: SS and CJK. Software: SS and CJK. Supervision: CJK. Validation: CJK, HSK, and EAS. Visualization: CJK. Writing–original draft: SS and CJK. Writing–review & editing: all authors.
CONFLICTS OF INTEREST
No existing or potential conflict of interest relevant to this article was reported.
FUNDING
This work was partly supported by the National Research Foundation of Korea grant funded by the Korea government (MSIT) (No. 2021R1A2C2007858). The funder did not play any role in the conduct or publication of the study.
DATA AVAILABILITY
The data are not publicly available due to further analyses.
Acknowledgements
The authors acknowledge with gratitude the most competent assistance of Drs. MA YOO, EJ SEO and B-T KIM, MD and the cooperation of the study participants and clinical staff of outpatient clinics in Ajou University Hospital.