Warning: mkdir(): Permission denied in /home/virtual/lib/view_data.php on line 81

Warning: fopen(upload/ip_log/ip_log_2024-07.txt): failed to open stream: No such file or directory in /home/virtual/lib/view_data.php on line 83

Warning: fwrite() expects parameter 1 to be resource, boolean given in /home/virtual/lib/view_data.php on line 84
The Association between Chronic Diseases and Active Patient Participation

The Association between Chronic Diseases and Active Patient Participation

Article information

Korean J Health Promot. 2017;17(3):152-160
Publication date (electronic) : 2017 January 19
doi : https://doi.org/10.15384/kjhp.2017.17.3.152
Department of Family Medicine, Busan Paik Hospital, Inje University College of Medicine, Busan, Korea
Corresponding author : Jinseung Kim, MD Department of Family Medicine, Busan Paik Hospital, Inje University College of Medicine, 75 Bokji-ro, Busanjin-gu, Busan 47392, Korea Tel: +82-51-890-6683, Fax: +82-51-894-7554 E-mail: jinseungkim@inje.ac.kr
Received 2017 June 14; Accepted 2017 August 09.

Abstract

Background:

Active patient participation in health care decision-making can results in better medical outcomes. This study's purpose is to investigate the association between the patient participation and the diseases often encountered in primary care.

Methods:

We used the data from the Korean National Health and Nutrition Examination Survey conducted in 2015 which included 4,158 adults aged older than 19 and who had no missing data. The association between the presence of disease or the number of accompanying diseases and the active patient participation in the treatment decision was studied. Logistic regression analysis was conducted using complex sampling design in each sex.

Results:

After adjusting for confounding variables, the relationship between active patient participation and the diagnosis of hypertension, odds ratio (OR) was 1.95 (95% confidence interval [CI], 1.25-3.04) for men and 1.83 (95% CI, 1.27-2.65) for women. In women diagnosed with diabetes, OR was 0.58 (95% CI, 0.35-0.97). Between active patient participation and increasing number of accompanying diseases have positive tendency but not statistically significant.

Conclusions:

This study suggests that active patient participation is related to the diagnosis of hypertension, and the number of accompanying diseases and active patient participation were not significantly associated. This is a rare study related to the active patient participation in the Korean population, that it may be helpful in establishing further relevant research and strategies to increase the patient participation rate.

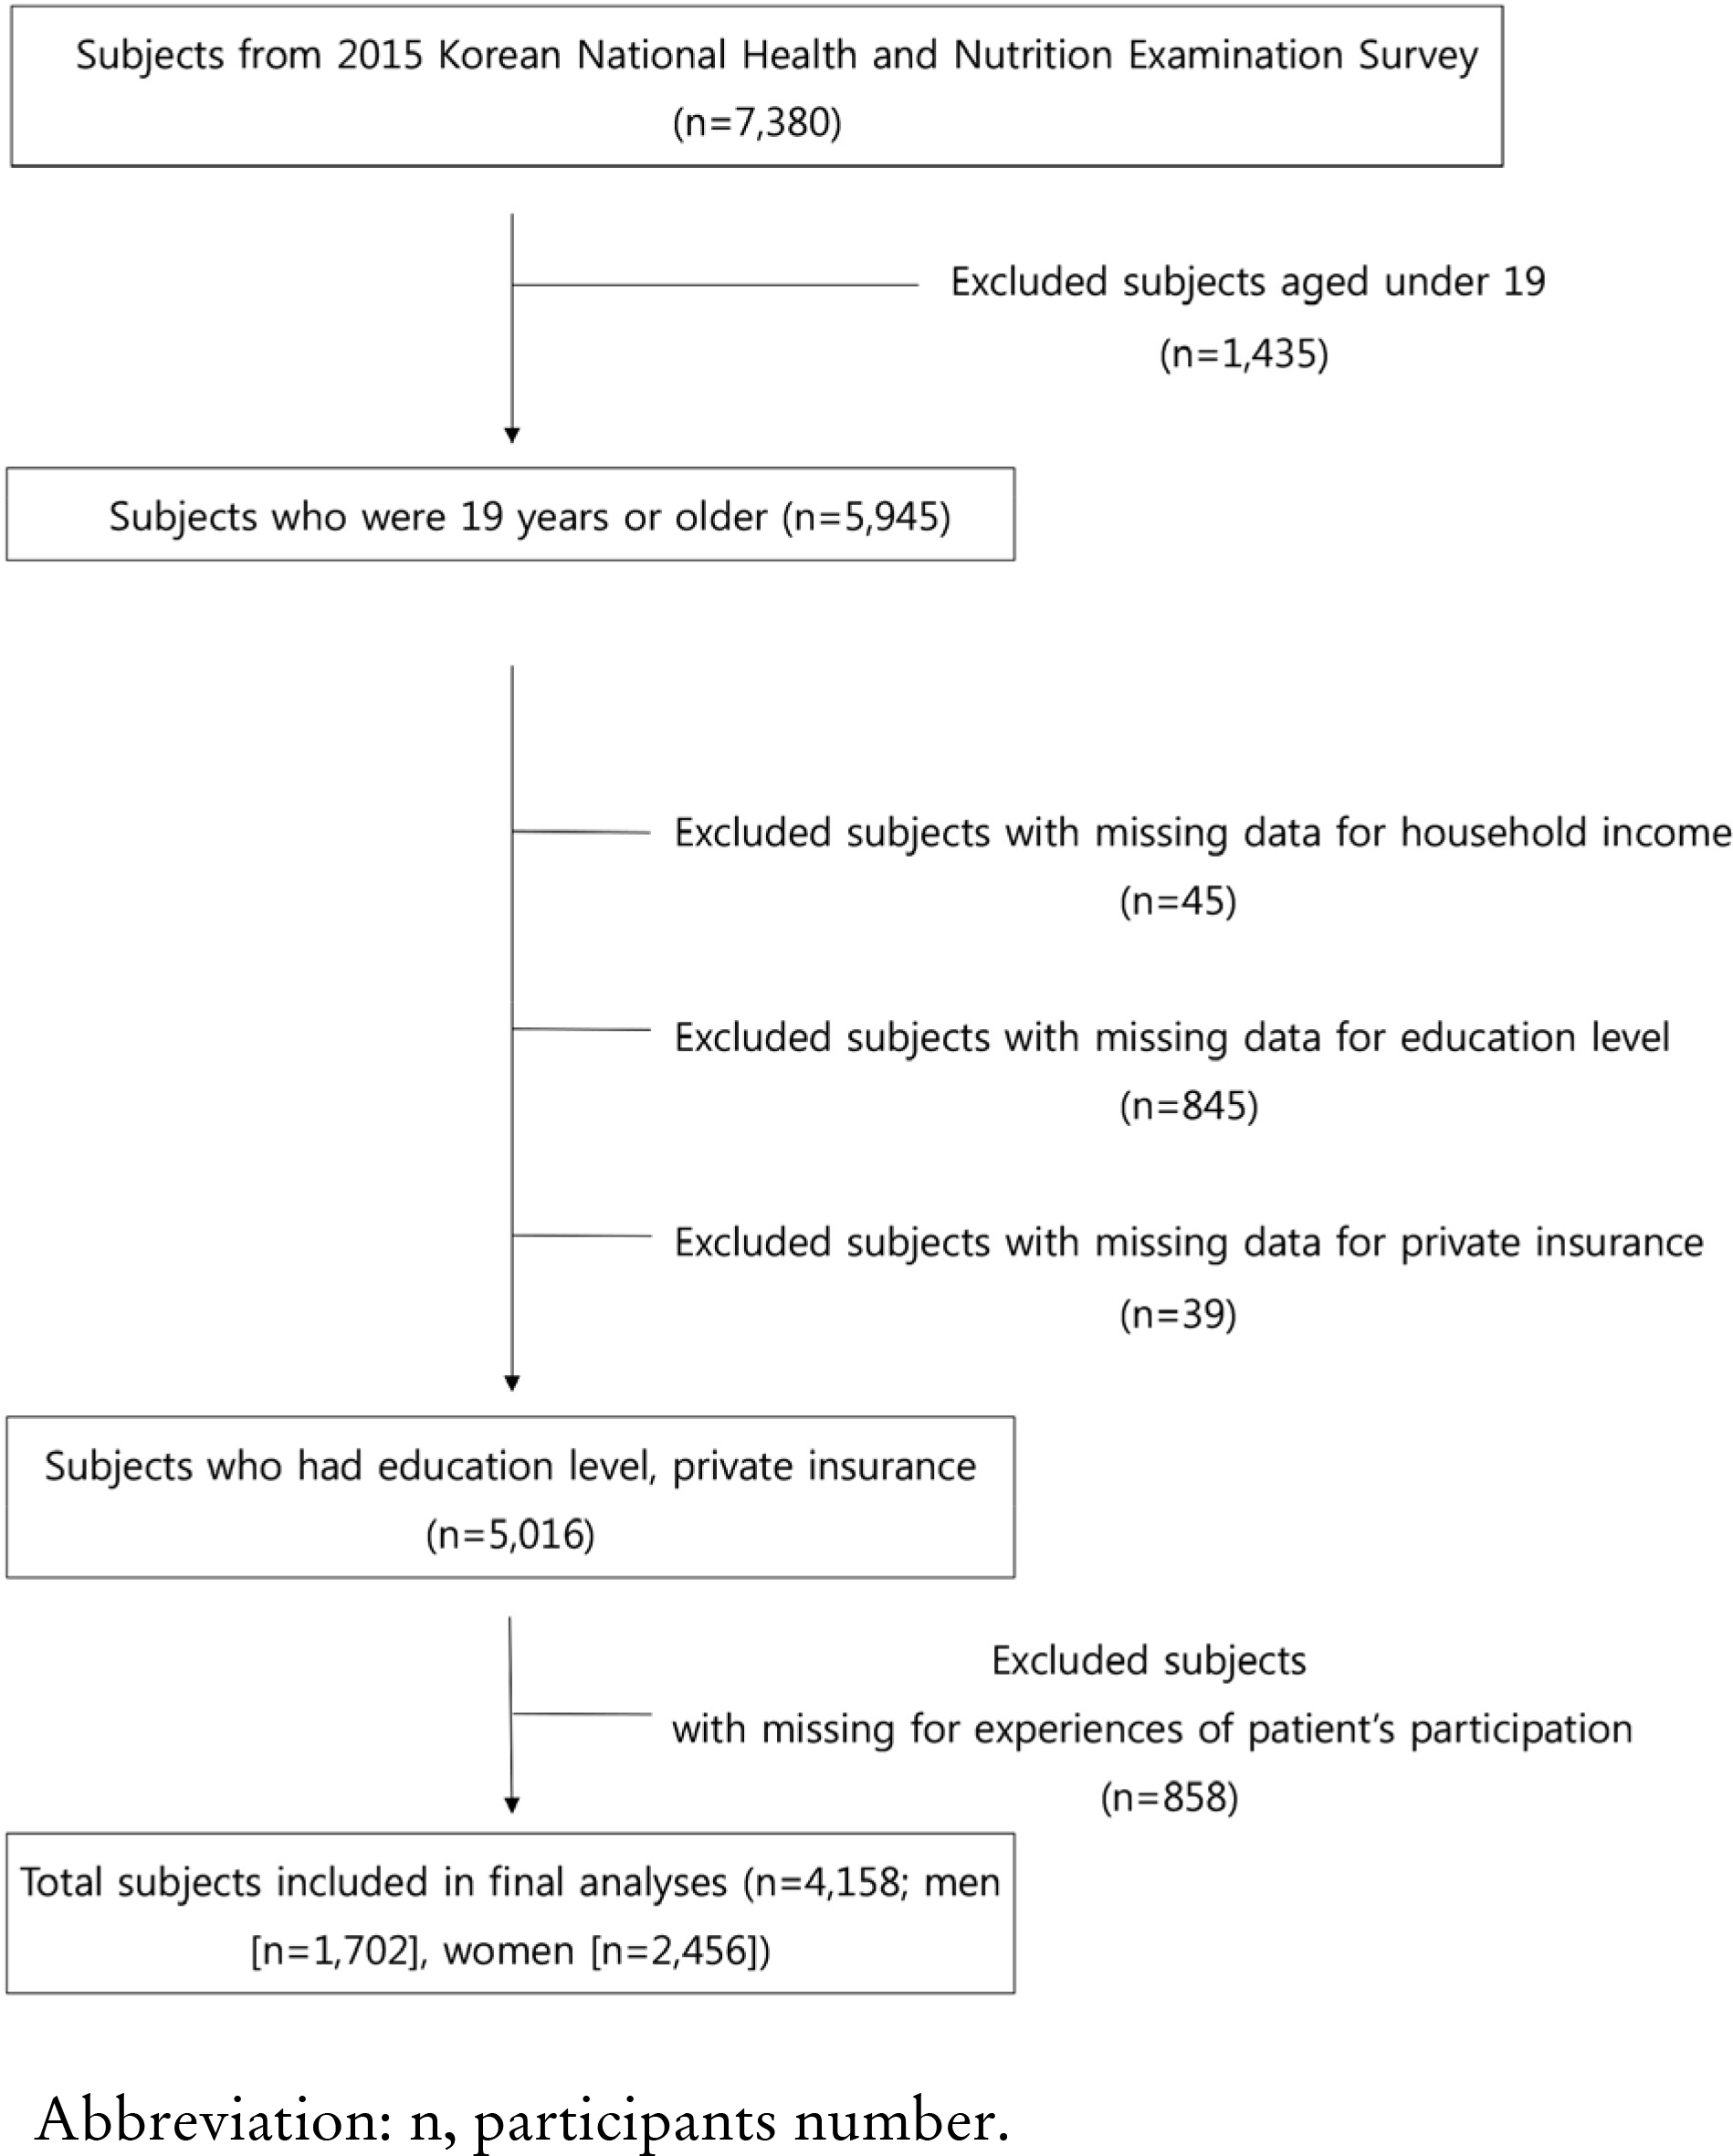
Figure 1.

Flow chart of subjects’ selection.

The relationships of active patient participation with age, household income, education level, private insurance, and disease

Odds ratio for active patient participation according to the diagnosis of disease by logistic regression

Odds ratio for active patient participation according to the number of diseases by logistic regression

Analysis of changes in outcome with or without hypertension in dyslipidemia patients

Analysis of changes in outcome with or without hypertension in stroke patients

References

1. Haynes RB, Taylor DW, Sackett DL. Compliance in health care Baltimore: Johns Hopkins University Press; 1979.
2. Becker MH, Maiman LA. Sociobehavioral determinants of compliance with health and medical care recommendations. Med Care 1975;13(1):10–24.
3. Becker MH. Patient adherence to prescribed therapies. Med Care 1985;23(5):539–55.
4. Jeong YY. Adherence: implications for asthma treatment. Allergy Asthma Respir Dis 2013;1(2):105–10.
5. DiMatteo MR, Sherbourne CD, Hays RD, Ordway L, Kravitz RL, McGlynn EA, et al. Physicians' characteristics influence patients' adherence to medical treatment: results from the Medical Outcomes Study. Health Psychol 1993;12(2):93–102.
6. Roter DL, Hall JA. Strategies for enhancing patient adherence to medical recommendations. JAMA 1994;271(1):80.
7. Wissow LS, Roter D, Bauman LJ, Crain E, Kercsmar C, Weiss K, et al. Patient-provider communication during the emergency department care of children with asthma. The National Cooperative Inner-City Asthma Study, National Institute of Allergy and Infectious Diseases, NIH, Bethesda, MD. Med Care 1998;36(10):1439–50.
8. Lee JH, Kim CJ. Effect of patient-centered communication of doctor on patient participation: focusing on moderating effect of trust. J of Korea Contents Association 2013;13(3):278–86.
9. Bell JA, Balneaves LG. Cancer patient decision making related to clinical trial participation: an integrative review with implications for patients' relational autonomy. Support Care Cancer 2015;23(4):1169–96.
10. Schanen JG, Iribarren C, Shahar E, Punjabi NM, Rich SS, Sorlie PD, et al. Asthma and incident cardiovascular disease: the Atherosclerosis Risk in Communities Study. Thorax 2005;60(8):633–8.
11. Statistics Korea. 2015 Cause of death statistics (nationwide) [Internet] Daejeon: Statistics Korea; 2017. [Accessed Jun 5, 2017]. Available from: http://kosis.kr/statHtml/statHtml.do?orgId=101&tblId=DT_1B34E09&conn_path=I2.
12. Coentre R, Talina MC, Góis C, Figueira ML. Depressive symptoms and suicidal behavior after first-episode psychosis: a comprehensive systematic review. Psychiatry Res 2017;253:240–8.
13. Kim SO. Medication adherence of elderly with hypertension and/or diabetes-mellitus and its' Influencing factors. Korean J Clin Pharm 2011;21(2):81–9.
14. Lee JS, Lee ES, Yang YJ, Yoon YS, Lee JH, Ji HA, et al. Comparison of characteristics between compliant and non-compliant for dyslipidemia treatment -using Korean national health and nutrition examination survey 2009~2012. Korean J Fam Pract 2015;5(3):S738–44.
15. Moon DS, An SM, Kim KH, Kim YJ, Lee SM, Paik JW. The factors associated with antidepressant adherence in outpatients with depressive disorder. Korean J Psychopharmacol 2015;26(2):35–42.
16. García-Pérez LE, Alvarez M, Dilla T, Gil-Guillén V, Orozco-Beltrán D. Adherence to therapies in patients with type 2 diabetes. Diabetes Ther 2013;4(2):175–94.
17. Sunwoo D, Song HJ, Hwang NM, Kang EJ, Seo YJ, Kim TI, et al. The development of health care system for older Koreans: reports 2005-04 Seoul: Korea institute for health and social affairs; 2005.
18. Singh JA, Sloan JA, Atherton PJ, Smith T, Hack TF, Huschka MM, et al. Preferred roles in treatment decision making among patients with cancer: a pooled analysis of studies using the control preferences scale. Am J Manag Care 2010;16(9):688–96.
19. Lee CN, Chang Y, Adimorah N, Belkora JK, Moy B, Partridge AH, et al. Decision making about surgery for early-stage breast cancer. J Am Coll Surg. 2012;214(1):1–10.
20. Zikmund-Fisher BJ, Couper MP, Singer E, Ubel PA, Ziniel S, Fowler FJ Jr, et al. Deficits and variations in patients' experience with making 9 common medical decisions: the DECISIONS survey. Med Decis Making 2010;30(5 Suppl):85S–95.
21. Hoffman RM, Elmore JG, Fairfield KM, Gerstein BS, Levin CA, Pignone MP. Lack of shared decision making in cancer screening discussions: results from a national survey. Am J Prev Med 2014;47(3):251–9.
22. Brom L, Hopmans W, Pasman HR, Timmermans DR, Widdershoven GA, Onwuteaka-Philipsen BD. Congruence between patients' preferred and perceived participation in medical decision-making: a review of the literature. BMC Med Inform Decis Mak 2014;14:25.
23. Sullivan DR, Golden SE, Ganzini L, Wiener RS, Eden KB, Slatore CG. Association of decision-making with patients' perceptions of care and knowledge during longitudinal pulmonary nodule surveillance Ann Am Thorac Soc 2017 May 10. [Epub ahead of print].
24. Levinson W, Kao A, Kuby A, Thisted RA. Not all patients want to participate in decision making. A national study of public preferences. J Gen Intern Med 2005;20(6):531–5.
25. Chewning B, Bylund CL, Shah B, Arora NK, Gueguen JA, Makoul G. Patient preferences for shared decisions: a systematic review. Patient Educ Couns 2012;86(1):9–18.
26. Keating NL, Guadagnoli E, Landrum MB, Borbas C, Weeks JC. Treatment decision making in early-stage breast cancer: should surgeons match patients' desired level of involvement? J Clin Oncol 2002;20(6):1473–9.
27. Clayman ML, Bylund CL, Chewning B, Makoul G. The impact of patient participation in health decisions within medical encounters: a systematic review. Med Decis Making 2016;36(4):427–52.

Article information Continued

Figure 1.

Flow chart of subjects’ selection.

Table 1.

The relationships of active patient participation with age, household income, education level, private insurance, and disease

  Men Women
  % (SE) Pa % (SE) Pa
Age (y)   0.493   0.238
19-29 85.2 (2.5)   84.9 (2.0)  
30-39 85.4 (2.6)   89.1 (1.6)  
40-49 84.3 (2.7)   87.0 (1.9)  
50-59 87.2 (2.3)   87.8 (1.7)  
60-69 89.8 (1.7)   89.6 (1.6)  
70-79 90.3 (2.3)   91.6 (1.7)  
More than 80 90.7 (5.0)   84.9 (4.6)  
Household income   0.171   0.459
Low 86.1 (2.5)   89.7 (1.4)  
Low-middle 83.6 (2.3)   86.8 (1.4)  
High-middle 89.5 (1.7)   88.6 (1.3)  
High 85.9 (1.8)   87.0 (1.4)  
Education level   0.920   0.179
Less than elementary school 88.0 (2.5)   88.5 (1.6)  
Middle school 86.5 (3.1)   92.2 (1.7)  
High school 86.7 (1.6)   87.4 (1.4)  
College or higher 86.0 (1.6)   86.8 (1.3)  
Private insurance   0.995   0.201
Yes 86.5 (1.2)   87.5 (0.8)  
No 86.5 (2.0)   89.7 (1.4)  
Chronic disease        
Diabetes mellitus   0.675   0.454
Yes 87.7 (2.8)   85.9 (2.7)  
No 86.4 (1.1)   88.0 (0.8)  
Asthma   0.251   0.702
Yes 79.3 (7.0)   86.4 (4.2)  
No 86.8 (1.0)   87.9 (0.7)  
Hypertension   <0.001   0.001
Yes 92.1 (1.2)   91.9 (1.1)  
No 84.9 (1.2)   86.9 (0.9)  
Dyslipidemia   0.060   0.332
Yes 90.7 (2.1)   89.5 (1.6)  
No 85.9 (1.1)   87.6 (0.9)  
Stroke   0.060   0.312
Yes 93.4 (3.8)   91.6 (3.3)  
No 86.4 (1.0)   87.8 (0.7)  
Angina pectoris or MI   0.136   0.628
Yes 92.7 (3.6)   89.7 (3.5)  
No 86.4 (1.0)   87.8 (0.8)  
Depression   0.203   0.592
Yes 78.7 (6.9)   86.3 (3.0)  
No 86.7 (1.0)   88.0 (0.8)    

Abbreviations: MI, myocardial infarction; N, partispants number; SE, standard error.

a

Categorical variables were calculated by chi-square test.

Table 2.

Odds ratio for active patient participation according to the diagnosis of disease by logistic regression

Disease Sex Adjusted OR (95% CI)a Pb
Diabetes mellitus Men 0.82 (0.43-1.55) 0.538
Women 0.58 (0.35-0.97) 0.038
Asthma Men 0.57 (0.24-1.36) 0.204
Women 0.85 (0.41-1.74) 0.649
Hypertension Men 1.95 (1.25-3.04) 0.003
Women 1.83 (1.27-2.65) 0.001
Dyslipidemia Men 1.27 (0.72-2.26) 0.408
Women 1.04 (0.66-1.64) 0.863
Stroke Men 1.66 (0.46-6.01) 0.437
Women 1.03 (0.41-2.59) 0.949
Angina pectoris or MI Men 1.65 (0.58-4.67) 0.346
Women 0.90 (0.39-2.06) 0.800
Depressive disorder Men 0.59 (0.24-1.46) 0.252
Women 0.77 (0.44-1.32) 0.337

Abbreviations: OR, odds ratio; CI, confidence interval; MI, myocardial infarction.

a

Logistic regression for active participants according to disease after adjustment for age, household incomes, education level, private insurance, and disease (diabetes mellitus, asthma, hypertension, dyslipidemia, stroke, angina pectoris or MI, depressive disorder) except for Independent variable.

b

Assessed by logistic regression analysis.

Table 3.

Odds ratio for active patient participation according to the number of diseases by logistic regression

Sex Number of diseases Adjusted OR (95% CI)a
Both (n=4,158)    
0 (n=2,386, 57.4) 1
1 (n=969, 23.3) 1.12 (0.84-1.50)
2 (n=526, 12.7) 1.22 (0.81-1.83)
More than 3 (n=277, 6.7) 1.55 (0.90-2.65)
Men (n=1,702)    
0 (n=958, 56.3) 1
1 (n=416, 24.4) 1.145 (0.74-1.77)
2 (n=222, 13.0) 1.376 (0.78-2.44)
More than 3 (n=106, 6.2) 2.570 (0.94-7.01)
Women (n=2,456)    
0 (n=1,428, 58.1) 1
1 (n=553, 22.5) 1.11 (0.75-1.65)
2 (n=304, 12.4) 1.10 (0.62-1.96)
More than 3 (n=171, 7.0) 1.11 (0.59-2.05)

Abbreviations: OR, odds ratio; CI, confidence interval; n, participants number.

a

Logistic regression for active participants according to the number of diseases after adjustment for age, household incomes, education level, and private insurance.

Table 4.

Analysis of changes in outcome with or without hypertension in dyslipidemia patients

Sex Controla Hypertension without dyslipidemia Dyslipidemia without hypertension Dyslipidemia with hypertension
OR (95% CI)b
Men 1,099 (64.6) 339 (19.9) 98 (5.8) 166 (9.8)
  1 2.01 (1.24-3.27) 1.32 (0.60-2.94) 2.30 (1.10-4.81)
Women 1,615 (65.8) 337 (13.7) 218 (8.9) 286 (11.6)
  1 1.60 (1.01-2.54) 0.92 (0.54-1.57) 2.19 (1.25-3.83)

Abbreviations: OR, odds ratio; CI, confidence interval. Values are presented as participants number (%) unless otherwise indicated.

a

Patients with diseases except hypertention and dyslipidemia.

b

Logistic regression for active participants according to changes in outcome with hypertension in dyslipidemia patients after adjustment for age, household incomes, education level, private insurance, and disease (diabetes mellitus, asthma, stroke, angina pectoris or MI, depressive disorder).

Table 5.

Analysis of changes in outcome with or without hypertension in stroke patients

Sex Controla Hypertension without stroke Stroke without hypertension Stroke with hypertension
OR (95% CI)b
Men 1,181 (69.4) 466 (27.4) 16 (0.9) 39 (2.3)
1 1.88 (1.185-2.981) 0.98 (0.17-5.57) 6.38 (1.40-29.13)
Women 1,821 (74.1) 581 (23.7) 12 (0.5) 42 (1.7)
1 1.84 (1.26-2.68) 1.10 (0.21-5.70) 1.80 (0.61-5.34)

Abbreviations: OR, odds ratio; CI, confidence interval. Values are presented as participants number (%) unless otherwise indicated.

a

Patients with diseases except hypertention and stroke.

b

Logistic regression for active participants according to changes in outcome with hypertension in stroke patients after adjustment for age, household incomes, education level, private insurance, and disease (diabetes mellitus, asthma, dyslipidemia, angina pectoris or MI, depressive disorder).