Correlation between Coarse Airborne Particulate Matter and Mortality Rates of Malignant Neoplasm
Article information
Abstract
Background
There have been growing interests in harmful effects of dust particles on human health. It has been reported that dust particles negatively affected respiratory and cardiovascular systems. Relationship of dust particles and lung cancer incidence was also investigated. However, there is a lack of studies regarding the relationship between dust particles and cancers except for lung cancer. Therefore, this study aimed to determine the relationship of dust particle concentration and cancer mortality in Korea.
Methods
Average concentration of coarse dust particles (particulate matter 10, PM10) of 2008–2014 were obtained from AirKorea website and cancer mortality was found in Statistics Korea for 2008–2014. Correlation analyses using PM10 and cancer mortality were performed. Age-adjusted death rate (AADR) was used for correlation analysis because a number of death and mortality rate do not reflect population and age of death. Regional annual PM10 was matched with AADR of identical area. Correlation between two variables was presented in scatter plots and Pearson's correlation analysis was performed.
Results
PM10 concentration was positively correlated with AADR of malignant neoplasm, lung cancer, stomach cancer, colon cancer, uterus cancer, and leukemia. PM10 concentration was significantly correlated with AADR of malignant neoplasm (r=0.247, P=0.009), lung cancer (r=0.277, P=0.003), stomach cancer (r=0.434, P=0.000), colon cancer (r=0.377, P=0.000), and uterus cancer (r=0.226, P=0.017).
Conclusion
This study suggested that cancer patients or high-risk group for cancer should pay attention to PM10 concentration. Large-scale studies should investigate the relationship of PM10 concentration and cancer incidence including cancer mortality to extend understanding of this cross-section study.
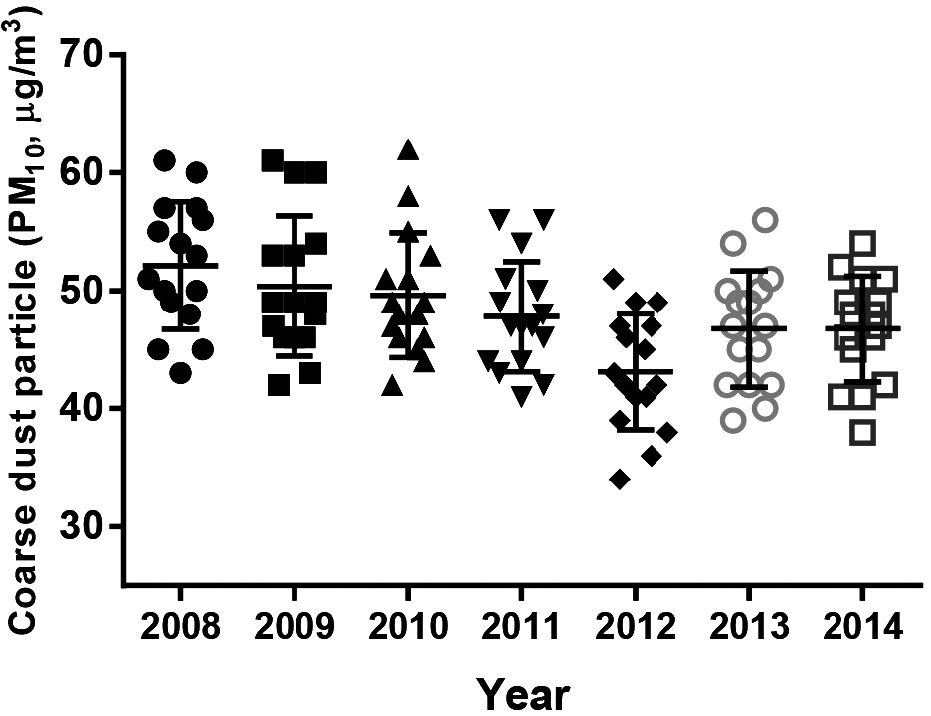
Changes in annual average of coarse particles (particulate matter 10: particles whose aerodynamic diameters are less than or equal to 10 µm).
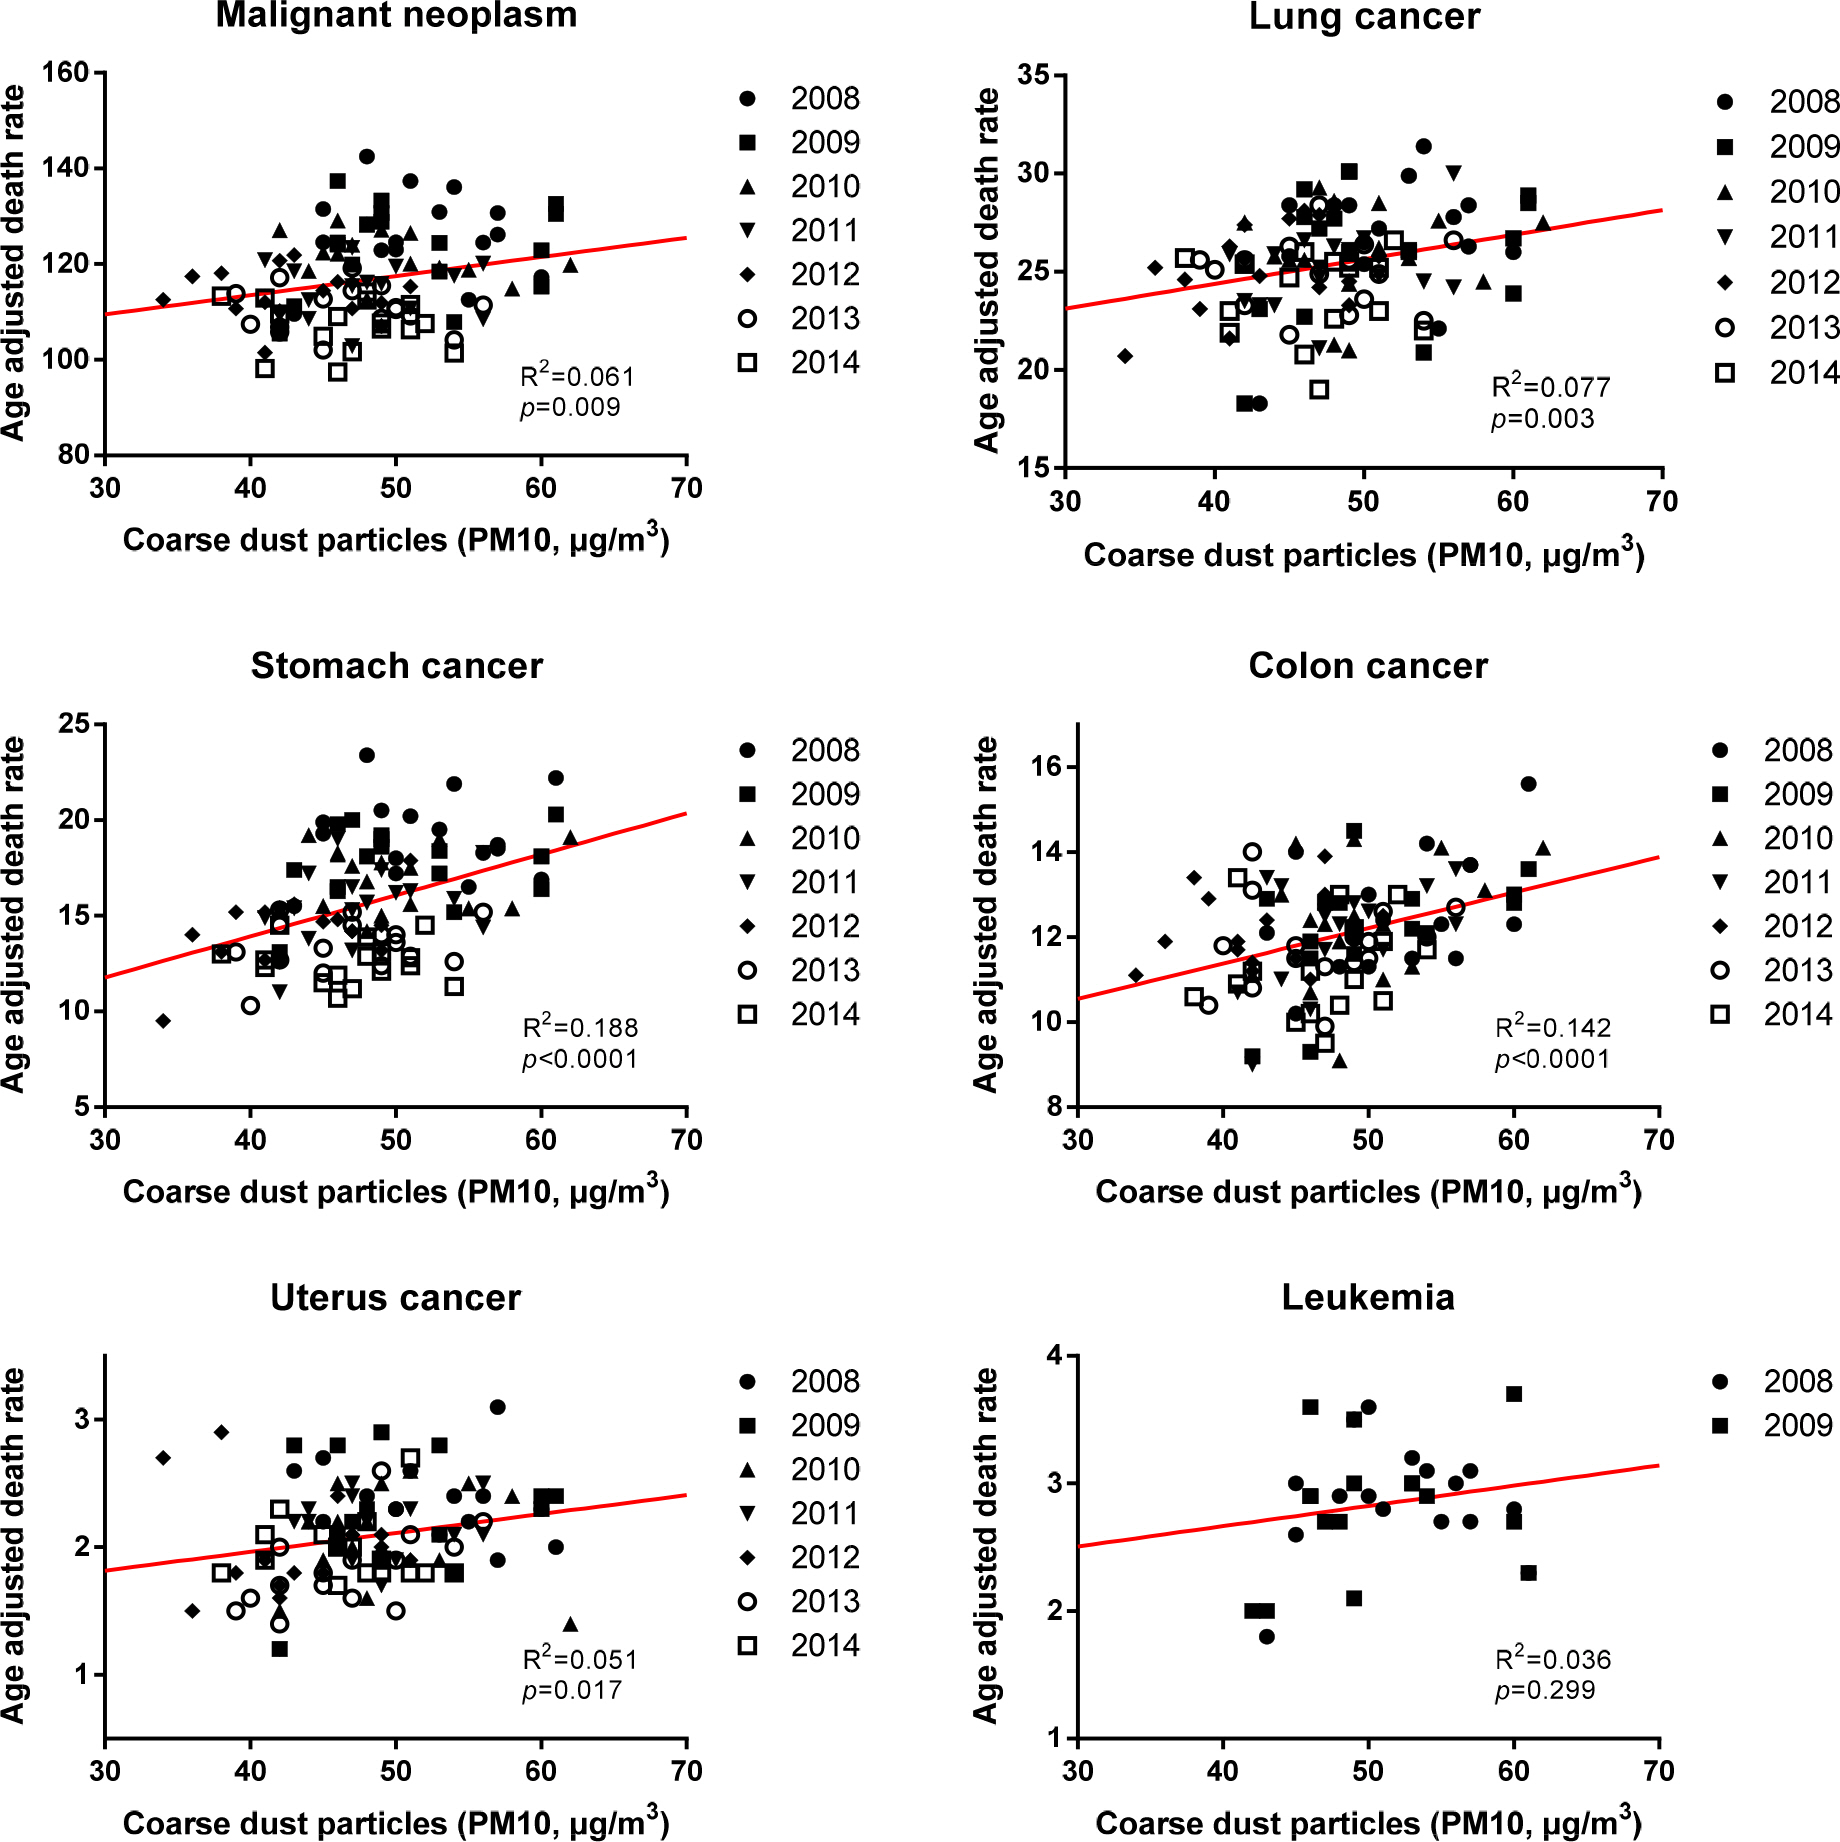
Pearson's correlation analysis of PM10 (particulate matter 10: particles whose aerodynamic diameters are less than or equal to 10 µm) concentrationand age adjusted death rates of malignant neoplasms, lung cancer, stomach cancer, colon cancer, uterus cancer, and leukemia.


Kendall's tau-b correlation coefficient of PM10 (particulate matter 10: particles whose aerodynamic diameters are less han or equal to 10 µm)concentrationand age adjusted death rates of cancer in regions of South Korea from 2008 to 2014