

| Korean J Health Promot > Volume 16(1); 2016 > Article |

|
Tel: +82-2-2270-0097, Fax: +82-2-2272-0908 E-mail: yangim.hur@gmail.com
Received August 17, 2015 Accepted October 26, 2015
ABSTRACT
Background
Influenza causes morbidity and mortality, resulting in the medical and socioeconomic costs. We aimed to analyse whether socioeconomic and medical factors may affect influenza vaccination status divided into 2 groups; one aged 19 to 64 years old and the other aged 65 or over who are eligible for free vaccination.
Methods
The study included 1,412 individuals aged 19 and over who responded to influenza vaccination survey, based on 2013 National Health and Nutrition Examination Survey. Related factors were categorized into socioeconomic factors and medical factors. Univariate analyses were conducted to examine the correlations between vaccination rate and each variables. Multivariate analysis was obtained after adjusting variables which were statistcally significant.
Results
Influenza vaccination rate was significantly different in the population aged 19 to 64 (24.9%) and the population aged 65 or over (80.5%). In the former population, high vaccination rate was associated with healthcare usage (odds ratio [OR]=1.37, 95% confidence interval [CI]=1.03–1.83), underlying chronic diseases (OR=2.21, 95% CI=1.43–3.40), and public assistance recipient households (OR=2.21, 95% CI=1.03–4.78), while low vaccination rate was correlated with no use of medical check up (OR=0.70, 95% CI=0.52–0.94) and heavy alcoholics (OR=0.41, 95% CI=0.24–0.70). In the latter population aged 65 or over, high vaccination rate was associated with healthcare usage (OR=1.82, 95% CI=1.28–2.59), and underlying malignancies (OR= 4.79, 95% CI=1.07–21.54), whereas low vaccination rate was associated with public assistance recipient households (OR=0.33, 95% CI=0.14–0.76), and no use of medical check up (OR=0.37, 95% CI=0.19–0.73).
Conclusions
In the population below 65 years old, vaccination rate would be expected to rise by the recommendation of medical care providers and expanding the coverage of free vaccination. In elderly, individualized care for those who have less access to medical care and high susceptibility is highly recommended.
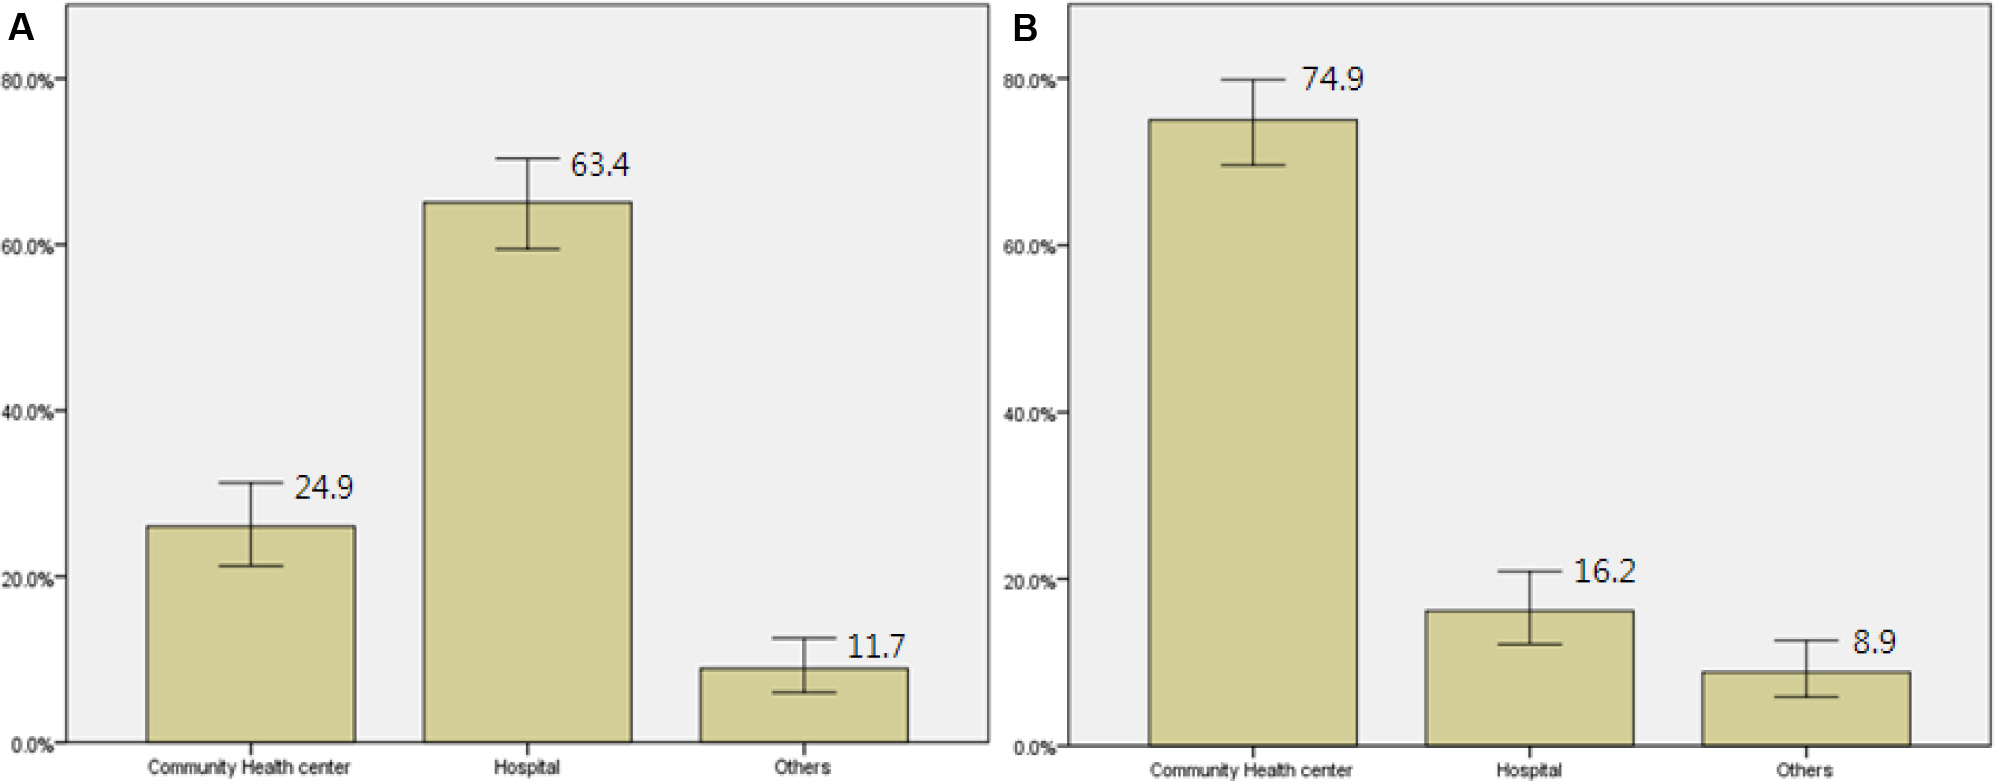
Table 1.
Influenza vaccination rates by age
| Characteristics | Age 19–64 years (n=1,073) | Age 65 years (n=339) | ||||
|---|---|---|---|---|---|---|
| N, | Vaccinated | P value | N, | Vaccinated | P value | |
| Weighted% | Weighted | Weighted% | Weighted | |||
| %(S.E.) | %(S.E.) | |||||
| Total | 1,073 (83.8) | 24.9 (1.6) | 339 (16.2) | 80.5 (2.7) | ||
| Age group | <0.001 | 0.127 | ||||
| <50 | 653 (66.3) | 21.2 (1.9) | ||||
| 50–64 | 420 (33.7) | 32.3 (2.1) | ||||
| 65–74 | 228 (62.9) | 78.3 (3.1) | ||||
| ≥ 75 | 111 (37.1) | 84.2 (3.3) | ||||
| Sex | 0.004 | 0.005 | ||||
| Man | 453 (50.8) | 21.2 (2.2) | 149 (42.4) | 74.5 (4.0) | ||
| Woman | 620 (49.2) | 28.8 (1.7) | 190 (57.6) | 84.9 (2.5) | ||
| Education | 0.086 | 0.024 | ||||
| Elementary | 135 (10.0) | 31.9 (4.6) | 206 (62.5) | 84.5 (3.0) | ||
| Middle | 115 (10.2) | 32.1 (5.4) | 53 (16.2) | 71.9 (6.1) | ||
| High | 447 (44.2) | 20.9 (2.6) | 55 (14.6) | 71.9 (4.6) | ||
| College | 375 (35.6) | 25.8 (2.6) | 25 (6.7) | 82.8 (6.5) | ||
| House incomea | 0.904 | 0.140 | ||||
| Low | 123 (11.4) | 26.1 (3.9) | 168 (50.9) | 82.1 (2.9) | ||
| Middle | 602 (55.9) | 25.1 (2.0) | 139 (40.0) | 81.0 (3.4) | ||
| High | 348 (32.7) | 24.2 (2.9) | 32 (9.1) | 69.5 (7.6) | ||
| Town | 0.001 | 0.413 | ||||
| Urban | 759 (72.0) | 21.9 (1.3) | 222 (64.2) | 82.2 (3.4) | ||
| Rural | 314 (28.0) | 32.7 (3.0) | 117 (35.8) | 77.5 (4.5) | ||
| Region | 0.185 | 0.537 | ||||
| Mega cityb | 484 (49.5) | 22.9 (2.1) | 151 (44.3) | 78.6 (4.3) | ||
| The other | 589 (50.5) | 26.9 (2.2) | 188 (55.7) | 82.1 (3.5) | ||
| Public assistance recipient households | 0.067 | 0.112 | ||||
| Yes | 15 (1.5) | 38.9 (8.3) | 29 (10.0) | 73.6 (4.2) | ||
| No | 1,058 (98.5) | 24.7 (1.6) | 309 (90.0) | 81.2 (2.9) | ||
| Marital status | <0.001 | 0.127 | ||||
| Married/unmarried couple living together | 792 (68.6) | 29.4 (1.6) | 226 (62.8) | 77.2 (3.7) | ||
| Divorced/widowed/separated/never married | 281 (31.4) | 15.0 (2.7) | 113 (37.2) | 86.2 (3.8) | ||
| Private health insurance | 0.450 | 0.553 | ||||
| Yes | 923 (86.4) | 25.7 (1.5) | 98 (70.3) | 77.9 (5.3) | ||
| No | 141 (13.6) | 22.0 (4.7) | 237 (29.7) | 81.2 (2.9) | ||
| Perception on my health | 0.394 | 0.017 | ||||
| Good | 358 (34.0) | 22.7 (2.0) | 61 (15.2) | 69.8 (5.4) | ||
| Moderate | 556 (52.0) | 26.3 (2.0) | 166 (52.1) | 80.5 (2.7) | ||
| Poor | 158 (14.0) | 25.2 (3.5) | 112 (32.7) | 85.5 (3.6) | ||
| Medical check upc | 0.001 | 0.011 | ||||
| Yes | 708 (63.4) | 28.6 (1.5) | 215 (61.9) | 85.1 (2.8) | ||
| No | 365 (36.6) | 18.5 (2.4) | 124 (38.1) | 72.5 (4.5) | ||
| Limited social or physical activityd | 0.049 | 0.119 | ||||
| Yes | 64 (5.1) | 35.2 (5.8) | 67 (21.5) | 85.1 (3.3) | ||
| No | 1,009 (94.9) | 24.4 (1.6) | 272 (78.5) | 79.2 (3.0) | ||
| Health care usagee | 0.001 | <0.001 | ||||
| Yes | 508 (46.7) | 29.0 (1.9) | 207 (62.5) | 85.7 (2.3) | ||
| No | 565 (53.3) | 21.3 (1.8) | 132 (37.5) | 71.8 (3.8) | ||
| Occupation | 0.046 | 0.129 | ||||
| Yes | 704 (66.4) | 23.0 (1.7) | 99 (26.9) | 76.1 (3.5) | ||
| No | 369 (33.6) | 28.7 (2.5) | 240 (73.1) | 82.1 (3.0) | ||
| High risk drinkingf | <0.001 | 0.905 | ||||
| Yes | 136 (13.7) | 11.4 (2.7) | 11 (2.8) | 78.3 (2.8) | ||
| No | 937 (86.3) | 27.1 (1.6) | 328 (97.2) | 80.5 (2.7) | ||
| Smoking | 0.005 | 0.109 | ||||
| Current smoker | 233 (25.8) | 17.9 (2.4) | 34 (9.2) | 66.6 (10.1) | ||
| Ex smoker | 165 (16.2) | 24.6 (2.8) | 101 (30.0) | 80.2 (3.6) | ||
| Non smoker | 674 (57.9) | 28.0 (2.0) | 201 (60.8) | 82.9 (3.0) | ||
| BMI | 0.705 | 0.488 | ||||
| <25 | 708 (66.6) | 24.1 (1.8) | 236 (69.6) | 79.7 (2.9) | ||
| ≥ 25 | 358 (33.4) | 25.4 (2.9) | 103 (30.4) | 82.4 (3.7) | ||
| Chronic diseaseg | 220 (17.3) | 40.0 (3.6) | <0.001 | 203 (59.0) | 81.1 (2.9) | 0.632 |
| Cardiovascular diseaseh | 32 (2.5) | 37.4 (10.8) | 0.165 | 53 (15.0) | 85.4 (4.7) | 0.279 |
| Pulmonary diseasei | 65 (6.4) | 32.2 (4.5) | 0.096 | 39 (12.0) | 87.8 (6.1) | 0.294 |
| Hepatic diseasej | 23 (2.1) | 22.6 (6.6) | 0.734 | 9 (2.9) | 73.5 (10.9) | 0.473 |
| Malignancies | 28 (2.3) | 46.6 (8.4) | 0.013 | 39 (13.1) | 95.9 (2.6) | 0.003 |
| Underlying diseasek | <0.001 | 0.076 | ||||
| Yes | 301 (24.9) | 35.8 (2.8) | 243 (71.4) | 82.4 (2.8) | ||
| No | 772 (75.1) | 21.3 (1.7) | 96 (28.6) | 75.7 (4.2) | ||
aDividing the mean monthly household income into four groups by quartiles and then defined as low (Q1), middle (Q2+Q3), and high (Q4)
dAssesed by asking respondents if they had a limitation on daily life and social activities as a current health problem or a disability.
eAssesed by asking respondents if they had a hospitalization within one year, outpatient care within two weeks or using pharmacy within two weeks.
Table 2.
Characteristics associated with influenza vaccination in adults aged 19–64 years
Table 3.
Characteristics associated with influenza vaccination in adults aged ≥ 65 years
References
1. World Health Organization. Influenza (Seasonal) factsheet 2014. Geneva: World Health Organization; 2014. [Accessed July 2, 2015]. http://www.who.int/mediacentre/factsheets/fs211/en/.
2. Lu PJ, O'Halloran A, Bryan L, Kennedy ED, Ding H, Graitcer SB, et al. Trends in racial/ethnic disparities in influenza vaccination coverage among adults during the 2007–08 through 2011–12 seasons. Am J Infect Control 2014;42(7):763-9.


3. Suh M, Kang DR, Lee DH, Choi YJ, Tchoe B, Nam CM, et al. Socioeconomic Burden of Influenza in the Republic of Korea, 2007–2010. PLoS One 2013;8(12):): e84121..
4. Song JY, Lee JS, Wie SH, Kim HY, Lee J, Seo YB, et al. Prospective cohort study on the effectiveness of influenza and pneumococcal vaccines in preventing pneumonia development and hospitalization. Clin Vaccine Immunol 2015;22(2):229-34.
5. Osterholm MT, Kelley NS, Sommer A, Belongia EA. Efficacy and effectiveness of influenza vaccines: a systematic review and metaanalysis. Lancet Infect Dis 2012;12(1):36-44.
6. Korea Centers for Disease Control and Preventions. Influenza (Flu). Cheongju: Korea Centers for Disease Control and Preventions; 2015. [Accessed July 22, 2015].. http://www.cdc.go.kr/CDC/contents/CdcKrContentView.jsp?cid=61188&menuIds=HOME001-MNU1130-MNU1765-MNU1767-MNU1792.
7. Centers for Disease Control and Preventions. Seasonal Influenza: Flu Basics. Atlanta: Centers for Disease Control and Preventions; 2014. [Accessed July 22, 2015].. http://www.cdc.gov/flu/about/disease/index.htm.
8. Korea Centers for Disease Control and Prevention. Annual influenza coverage trends. Cheongju: Korea Centers for Disease Control and Preventions; 2015. [Accessd July 22, 2015].. http://www.cdc.go.kr/CDC/contents/CdcKrContentView.jsp?cid=2. 7739&menuIds=HOME001-MNU1130-MNU1124-MNU15. p. 63-MNU1566.
9. Park MB, Kim CB, Joo HS. Factors influencing on influenza vaccination coverage. The J Contents Association 2013;13(4):300-11.
10. Kim WJ, Chun BC, Cheong HJ, Lee JS. Management Policy Development for influenza vaccination efficiency. Atlanta: Centers for Disease Control and Prevention; 2005.
11. Kee SY, Lee JS, Cheong HJ, Chun BC, Song JY, Choi WS, et al. Influenza vaccine coverage rates and perceptions on vaccination in South Korea. J Infect 2007;55(3):273-81.
12. Kee SY, Cheong HJ, Chun BC, Kim WJ. Influenza vaccination coverage rate and factors associated with vaccination in people with chronic disease. Infect Chemother 2011;43(5):406-11.
13. Kang HS, Lee HJ, Kim MW. The correlates of influenza vaccination among Korean elderly men and women. J Korean Acad Community Health Nurs 2011;22(1):45-55.
14. Cho HS. Factors associated with influenza vaccination behavior among high-risk adults. Korea J Health Educ Promot 2002;19(2):127-38.
15. Korea National Health & Nutritions Examination Survey. Survey Data. Cheongju: Korea National Health & Nutritions Examination Survey; 2014. [Accessed May 20, 2015].. https://knhanes.cdc.go.kr/knhanes/index.do.
16. Ministry of Health and Welfare. Press Release. Reston: Ministry of Health and Welfare; 2015. [Accessed May 20, 2015].. http://www.mohw.go.kr/front_new/al/sal0301vw.jsp?PAR_MENU_ID=04&MENU_ID=0403&BOARD_ID=140&BOARD_F. LAG=00&CONT_SEQ=318814&page=1..
17. Korea National Health & Nutritions Examination Survey. Alcohol use. Cheongju: Korea National Health & Nutritions Examination Survey; 2014. [Accessed July 20, 2015].. https://knhanes.cdc.go.kr/knhanes/index.do.
18. Yang HJ, Cho SI. Influenza vaccination coverage among adults in Korea: 2008–2009 to 2011–2012 seasons. Int J Environ Res Public Health 2014;11(12):12162-73.
19. Takayama M, Wetmore CM, Mokdad AH. Characteristics associated with the uptake of influenza vaccination among adults in the United States. Prev Med 2012;54(5):358-62.
20. Palache A. Seasonal influenza vaccine provision in 157 countries (2004–2009) and the potential influence of national public health policies. Vaccine 2011;29(51):9459-66.
21. Blank PR, Schwenkglenks M, Szucs TD. Vaccination coverage rates in eleven European countries during two consecutive influenza seasons. J Infect 2009;58(6):446-58.
22. Lim HS, Bae GR, Min YS, Kim YT, Lee YK. Status on influenza vaccination in some community health centers. Korean J Epidemiol 2004;26(2):62-70.
23. Cho HM, Kim JY, Hwang SE, Kim JC, Kim MY, Lee SH. Association between living arrangements and influenza vaccination rates among elderly south korean people: the fifth Korea National Health and Nutrition Examination Survey (KNHANES V-2). Korean J Fam Med 2015;36(4):186-90.
24. Yim HJ, Park HA, Kang JH, Kim KW, Cho YG, Hur YI, et al. Marital status and health behaviors in middle-aged Korean adults: from the 2007–2010 Korea National Health and Nutrition Examination Survey. Korean J Health Promot 2012;12(4):178-86.
25. Nichol KL, Baken L, Nelson A. Relation between influenza vaccination and outpatient visits, hospitalization, and mortality in elderly persons with chronic lung disease. Ann Intern Med 1999;130(5):397-403.
26. Udell JA, Zawi R, Bhatt DL, Keshtkar-Jahromi M, Gaughran F, Phrommintikul A, et al. Association between influenza vaccination and cardiovascular outcomes in high-risk patients: a metaanalysis. JAMA 2013;310(16):1711-20.
27. Lee KC, Han K, Kim JY, GE , Han BD, Shin KE, et al. Socioeconomic status and other related factors of seasonal influenza vaccination in the South Korean adult population based on a nationwide cross-sectional study. PLoS One 2015;10(2):): e0117305..
28. Song YM, Oh JS, Han SH, Choi CH. Effectiveness of telephone and postcard reminders for the influenza vaccination: a study in the elderly who have visited a family practice center in a tertiary care hospital. Korean J Prev Med 2000;33(1):109-16.
 PDF Links
 PubReader
 ePub Link
 Full text via DOI
 Download Citation
 Print
Print


-
METRICS

-
- 9 Crossref
- 0 Scopus
- 1,728 View
- 6 Download
- Related articles
- Editorial Office
-
Department of Family Medicine, Asan Medical Center, 88, Olympic-ro 43-gil, Songpa-gu, Seoul 05505, Korea
Tel: +82-2-3010-3820 Fax: +82-2-3010-3815 E-mail: kshpdp@amc.seoul.kr
Copyright © 2026 by Korean Society For Health Promotion And Disease Prevention.
