

| Korean J Health Promot > Volume 16(3); 2016 > Article |

|
Tel: +82ŌĆÉ41ŌĆÉ550ŌĆÉ3998, Fax: +82ŌĆÉ41ŌĆÉ550ŌĆÉ3998 EŌĆÉmail: choiey0410@gmail.com
Received July 27, 2015 ┬Ā ┬Ā ┬Ā Accepted November 11, 2015
ABSTRACT
Background
Discordance between knee pain and radiologic osteoarthritis is wellŌĆÉknown. This study was to investigate factors associated with knee pain with different grades of knee osteoarthritis among Korean adults aged 50 years or more.
Methods
Total 5,978 Korean aged 50 years or more who underwent the radiographs of the knees were analyzed from Korean National Nutrition and Health Examination Survey conducted in 2010ŌĆÉ11. Radiographs of the knees were scored for osteoarthritis using the KellgrenŌĆÉLawrence scale. Multivariate logistic regression analysis adjusting for sociodemographic factors, lifestyle factors, comorbidity and health status was used for analysis.
Results
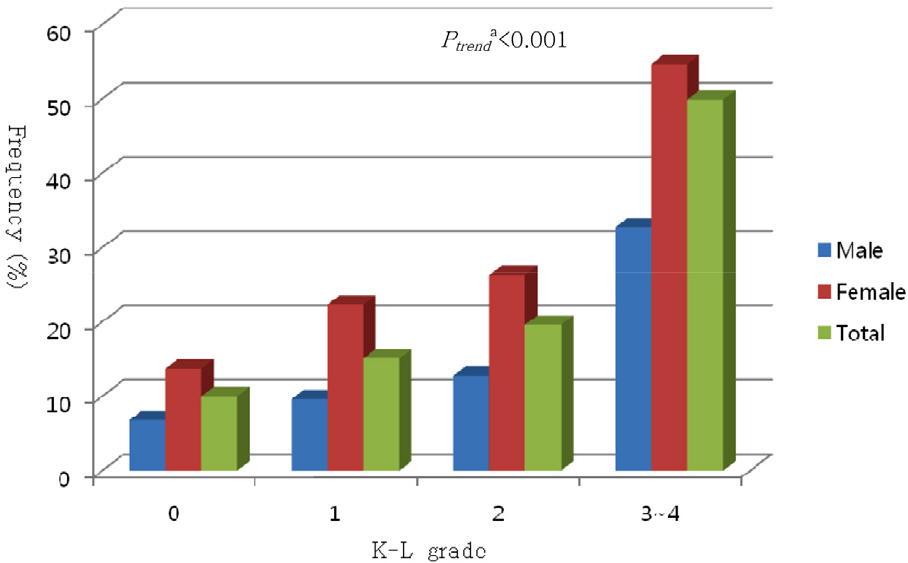
The prevalence of knee pain was higher in female compared to that of male (P<0.001), and increased as increasing severity of radiologic knee osteoarthritis. Female was associated with increased risk of knee pain in all of KellgrenŌĆÉLawrence degrees. In most of KellgrenŌĆÉLawrence degrees, depression was associated with increased risk of knee pain, and those with high school diploma or higher were associated with decreased risk of knee pain. A few factors (age, body mass index, and no alcohol drinking) were also associated with increased risk of knee pain for particular grades of radiographic knee osteoarthritis.
Conclusions
Knee pain increased as increasing severity of radiologic knee osteoarthritis. Although there were differences of risk factors associated with knee pain with different grades of knee osteoarthritis, female, depression were associated with increased of knee pain, and those with high school diploma or higher were associated with decreased risk of knee pain in most of KellgrenŌĆÉLawrence degrees.
Table┬Ā1.
Chacracteristics of participants according to the presence of knee paina
| ŃĆĆ | Knee pain (ŌĆÉ) | Knee pain (+) | Pb |
|---|---|---|---|
| N | 4,636 | 1,342 | ┬Ā |
| Female | 47.1 (0.7) | 75.4 (1.3) | <0.001 |
| Age, y | 61.1 (0.2) | 66.7 (0.4) | <0.001 |
| Married | 83.0 (0.7) | 65.5 (1.9) | <0.001 |
| BMI, kg/m2 | 23.9 (0.1) | 24.6 (0.1) | <0.001 |
| Education | ┬Ā | ┬Ā | <0.001 |
| Middle school | 60.4 (1.2) | 86.0 (1.1) | ┬Ā |
| High school | 26.7 (0.9) | 10.6 (1.0) | ┬Ā |
| University | 12.9 (0.9) | 3.4 (0.6) | ┬Ā |
| Alcohol use | 51.5 (0.9) | 32.9 (1.8) | <0.001 |
| Current smoking | 21.8 (0.8) | 12.6 (1.1) | <0.001 |
| Regular exercise | 49.0 (1.0) | 43.2 (1.8) | 0.002 |
| Manual Occupation | 37.7 (1.4) | 34.6 (2.1) | 0.083 |
| Diabetes | 16.5 (0.7) | 17.8 (1.5) | 0.427 |
| Hypertension | 48.4 (1.0) | 59.3 (1.8) | <0.001 |
| Depression | 13.3 (0.6) | 24.0 (1.4) | <0.001 |
| Osteoarthritis | 27.0 (0.9) | 63.2 (1.6) | <0.001 |
| KŌĆÉL grade | ┬Ā | ┬Ā | <0.001 |
| 0 | 48.5 (1.1) | 20.3 (1.5) | ┬Ā |
| 1 | 24.5 (0.8) | 16.5 (1.2) | ┬Ā |
| 2 | 13.4 (0.7) | 12.4 (1.1) | ┬Ā |
| 3 or 4 | 13.5 (0.7) | 50.8 (1.7) | ┬Ā |
Table┬Ā2.
Factors associated with knee paina
| ┬Ā | OR | P |
|---|---|---|
| Sex | ┬Ā | <0.001 |
| Male | 1.00 | ┬Ā |
| Female | 1.98 (1.58ŌĆÉ2.48) | ┬Ā |
| Age, y | 1.03 (1.02ŌĆÉ1.04) | <0.001 |
| Marital status | ┬Ā | 0.810 |
| Unmarried | 1.00 | ┬Ā |
| Married | 1.02 (0.82ŌĆÉ1.26) | ┬Ā |
| BMI, kg/m2 | 1.03 (0.99ŌĆÉ1.06) | 0.195 |
| Educationb | ┬Ā | <0.001 |
| Middle school | 1.00 | ┬Ā |
| High school | 0.51 (0.40ŌĆÉ0.65) | ┬Ā |
| University | 0.42 (0.28ŌĆÉ0.63) | ┬Ā |
| Alcohol use | ┬Ā | 0.438 |
| No | 1.00 | ┬Ā |
| Yes | 0.93 (0.76ŌĆÉ1.13) | ┬Ā |
| Smoking | ┬Ā | 0.917 |
| No | 1.00 | ┬Ā |
| Yes | 1.02 (0.77ŌĆÉ1.36) | ┬Ā |
| Regular exercise | ┬Ā | 0.273 |
| No | 1.00 | ┬Ā |
| Yes | 0.97 (0.74ŌĆÉ1.26) | ┬Ā |
| Occupation | ┬Ā | 0.215 |
| Office worker | 1.00 | ┬Ā |
| Manual worker | 1.13 (0.92ŌĆÉ1.37) | ┬Ā |
| Diabetes | ┬Ā | 0.707 |
| No | 1.00 | ┬Ā |
| Yes | 0.94 (0.74ŌĆÉ1.21) | ┬Ā |
| Hypertension | ┬Ā | 0.876 |
| No | 1.00 | ┬Ā |
| Yes | 1.05 (0.85ŌĆÉ1.29) | ┬Ā |
| Depression | ┬Ā | <0.001 |
| No | 1.00 | ┬Ā |
| Yes | 1.88 (1.51ŌĆÉ2.34) | ┬Ā |
| KŌĆÉL gradeb | ┬Ā | <0.001 |
| 0 | 1.00 | ┬Ā |
| 1 | 1.34 (1.01ŌĆÉ1.77) | ┬Ā |
| 2 | 1.77 (1.34ŌĆÉ2.34) | ┬Ā |
| 3 or 4 | 4.79 (3.76ŌĆÉ6.12) | ┬Ā |
Table┬Ā3.
Factors associated with knee pain according to KŌĆÉL gradea
References
1. Shin DW, Nam S, Bang YS, Lee JY. Estimation of the prevalence of Korean adults aged 50 years or more with knee osteoarthritis based on the data from fifth Korea National Health and Nutrition Examination Survey. J Korean Med Assoc 2013;56(5):): 431ŌĆÉ6..

2. Bedson J, Croft PR. The discordance between clinical and radiographic knee osteoarthritis: a systematic search and summary of the literature. BMC Musculoskelet Disord 2008;9:116.


3. Kim IJ, Kim HA, Seo YI, Jung YO, Song YW, Jeong JY, et al. Prevalence of knee pain and its influence on quality of life and physical function in the Korean elderly population: a community based crossŌĆÉsectional study. J Korean Med Sci 2011;26(9):): 1140ŌĆÉ6..
4. Schiphof D, Kerkhof HJ, Damen J, de Klerk BM, Hofman A, Koes BW, et al. Factors for pain in patients with different grades of knee osteoarthritis. Arthritis Care Res (Hoboken) 2013;65(5):): 695ŌĆÉ702..
5. Cho NH, Kim S, Kim HA, Seo YI. The prevalence and risk factors of knee and hand osteoarthritis in Korea. J Korean Rheum Assoc 2007;14(4):): 354ŌĆÉ62..
6. Kim I, Kim HA, Seo YI, Song YW, Jeong JY, Kim DH. The prevalence of knee osteoarthritis in elderly community residents in Korea. J Korean Med Sci 2010;25(2):): 293ŌĆÉ8..
7. Jhun HJ, Sung NJ, Kim SY. Knee pain and its severity in elderly Koreans: prevalence, risk factors and impact on quality of life. J Korean Med Sci 2013;28(12):): 1807ŌĆÉ13..
8. Han HS, Lee JY, Kang SB, Chang CB. The relationship between the presence of depressive symptoms and the severity of selfŌĆÉreported knee pain in the middle aged and elderly. Knee Surg Sports Traumatol Arthrosc 2016;24(5):): 1634ŌĆÉ42..
9. Cho HJ, Chang CB, Yoo JH, Kim SJ, Kim TK. Gender differences in the correlation between symptom and radiographic severity in patients with knee osteoarthritis. Clin Orthop Relat Res 2010;468(7):): 1749ŌĆÉ58..
10. Glass N, Segal NA, Sluka KA, Torner JC, Nevitt MC, Felson DT, et al. Examining sex differences in knee pain: the multicenter osteoarthritis study. Osteoarthritis Cartilage 2014;22(8):): 1100ŌĆÉ6..
11. Brandt KD, Heilman DK, Slemenda C, Katz BP, Mazzuca S, Braunstein EM, et al. A comparison of lower extremity muscle strength, obesity, and depression scores in elderly subjects with knee pain with and without radiographic evidence of knee osteoarthritis. J Rheumatol 2000;27(8):): 1937ŌĆÉ46..
12. Creamer P, LethbridgeŌĆÉCejku M, Costa P, Tobin JD, Herbst JH, Hochberg MC. The relationship of anxiety and depression with selfŌĆÉreported knee pain in the community: data from the Baltimore Longitudinal Study of Aging. Arthritis Care Res 1999;12(1):): 3ŌĆÉ7..
13. van Baar ME, Dekker J, Lemmens JA, Oostendorp RA, Bijlsma JW. Pain and disability in patients with osteoarthritis of hip or knee: the relationship with articular, kinesiological, and psychological characteristics. J Rheumatol 1998;25(1):): 125ŌĆÉ33..
14. Phyomaung PP, Dubowitz J, Cicuttini FM, Fernando S, Wluka AE, Raaijmaakers P, et al. Are depression, anxiety and poor mental health risk factors for knee pain? A systematic review. BMC Musculoskelet Disord 2014;15:10.
15. Yoshimura M, Furue H. Mechanisms for the antiŌĆÉnociceptive actions of the descending noradrenergic and serotonergic systems in the spinal cord. J Pharmacol Sci 2006;101(2):): 107ŌĆÉ17..
16. Leeuw M, Goossens ME, Linton SJ, Crombez G, Boersma K, Vlaeyen JW. The fearŌĆÉavoidance model of musculoskeletal pain: current state of scientific evidence. J Behav Med 2007;30(1):): 77ŌĆÉ94..
17. Hayley S, Poulter MO, Merali Z, Anisman H. The pathogenesis of clinical depression: stressorŌĆÉand cytokineŌĆÉinduced alterations of neuroplasticity. Neuroscience 2005;135(3):): 659ŌĆÉ78..
18. Pereira D, Severo M, Ramos E, Branco J, Santos RA, Costa L, et al. Potential role of age, sex, body mass index and pain to identify patients with knee osteoarthritis. Int J Rheum Dis 2015 May 7 [Epub ahead of print]..
19. Felson DT, Zhang Y, Hannan MT, Naimark A, Weissman B, Aliabadi P, et al. Risk factors for incident radiographic knee osteoarthritis in the elderly: the Framingham Study. Arthritis Rheum 1997;40(4):): 728ŌĆÉ33..
20. Rogers MW, Wilder FV. The association of BMI and knee pain among persons with radiographic knee osteoarthritis: a crossŌĆÉsectional study. BMC Musculoskelet Disord 2008;9:163.
21. Felson DT, Zhang Y, Anthony JM, Naimark A, Anderson JJ. Weight loss reduces the risk for symptomatic knee osteoarthritis in women. The Framingham Study. Ann Intern Med 1992;116(7):): 535ŌĆÉ9..
22. Hartz AJ, Fischer ME, Bril G, Kelber S, Rupley D, Jr. , Oken B, et al. The association of obesity with joint pain and osteoarthritis in the HANES data. J Chronic Dis 1986;39(4):): 311ŌĆÉ9..
23. Griffin TM, Guilak F. The role of mechanical loading in the onset and progression of osteoarthritis. Exerc Sport Sci Rev 2005;33(4):): 195ŌĆÉ200..
24. Visser M, Kritchevsky SB, Goodpaster BH, Newman AB, Nevitt M, Stamm E, et al. Leg muscle mass and composition in relation to lower extremity performance in men and women aged 70 to 79: the health, aging and body composition study. J Am Geriatr Soc 2002;50(5):): 897ŌĆÉ904..
25. Cecchi F, Mannoni A, MolinoŌĆÉLova R, Ceppatelli S, Benvenuti E, Bandinelli S, et al. Epidemiology of hip and knee pain in a community based sample of Italian persons aged 65 and older. Osteoarthritis Cartilage 2008;16(9):): 1039ŌĆÉ46..
26. Davis MA, Ettinger WH, Neuhaus JM, Barclay JD, Segal MR. Correlates of knee pain among US adults with and without radiographic knee osteoarthritis. J Rheumatol 1992;19(12):): 1943ŌĆÉ9..
27. Wesseling J, Bastick AN, ten Wolde S, Kloppenburg M, Lafeber F, BiermaŌĆÉZeinstra SM, et al. Identifying trajectories of pain severity in early symptomatic knee osteoarthritis: a 5ŌĆÉyear followup of the cohort hip and cohort knee (CHECK) study. J Rheumatol 2015;42(8):): 1470ŌĆÉ7..
28. Adamson J, Ebrahim S, Dieppe P, Hunt K. Prevalence and risk factors for joint pain among men and women in the West of Scotland TwentyŌĆÉ07 study. Ann Rheum Dis 2006;65(4):): 520ŌĆÉ4..
29. Williams JW Jr, Mulrow CD, Kroenke K, Dhanda R, Badgett RG, Omori D, et al. CaseŌĆÉfinding for depression in primary care: a randomized trial. Am J Med 1999;106(1):): 36ŌĆÉ43..
30. Yusuf E, Kortekaas MC, Watt I, Huizinga TW, Kloppenburg M. Do knee abnormalities visualised on MRI explain knee pain in knee osteoarthritis? A systematic review. Ann Rheum Dis 2011;70(1):): 60ŌĆÉ7..
 PDF Links
 PubReader
 ePub Link
 Full text via DOI
 Download Citation
 Print
Print


-
METRICS

-
- 2 Crossref
- 0 Scopus
- 1,494 View
- 0 Download
- Related articles
- Editorial Office
-
Department of Family Medicine, Asan Medical Center, 88, Olympic-ro 43-gil, Songpa-gu, Seoul 05505, Korea
Tel: +82-2-3010-3820 Fax: +82-2-3010-3815 E-mail: kshpdp@amc.seoul.kr
Copyright © 2026 by Korean Society For Health Promotion And Disease Prevention.
