성공적 노화 여부의 변화에 따른 주관적 건강 평가와 삶의 만족도: 고령화연구패널조사(2006-2018)
Successful Aging Transition and Its Impact on Self-Rated Health and Life Satisfaction: Findings from the Korean Longitudinal Study of Aging (2006-2018)
Article information

Abstract
연구배경
고령화 사회로 진입하면서 성공적 노화 개념의 중요성이 더욱 강조되고 있다. 성공적 노화 상태는 고정된 불변의 개념이 아니라 시간에 따라 변할 수 있으므로, 그 변화 양상 및 그것이 주관적 건강과 삶의 만족도에 미치는 영향을 평가해볼 필요가 있다.
방법
본 연구에서는 고령화연구패널조사(KLoSA)에 참여하였던 65세 이상의 노인 인구에서 2006년과 2018년의 성공적 노화 여부와 그 변화를 바탕으로 네 군으로 분류하였으며, 2018년에 조사된 주관적 건강평가와 삶의 만족도를 종속변수로 하여 로지스틱 회귀분석을 시행하였다.
결과
NSA→NSA군을 기준으로, 긍정적인 주관적 건강 평가에 대한 교차비는 SA→SA군에서 4.30 (95% CI, 1.64-11.31), NSA→SA군에서 3.92 (95% CI, 1.94-7.95), SA →NSA군에서 1.79 (95% CI, 1.28-2.50)로 나타났다. 높은 삶의 만족도는 SA→SA군에서 2.42 (95% CI, 1.19-4.94), NSA→SA군에서 2.50 (95% CI, 1.36-4.59)으로 나타났다.
결론
성공적 노화 상태를 유지하거나 성공적 노화 상태로 개선하는 것은 긍정적인 주관적 건강평가 및 높은 삶의 만족도와 유의한 연관성이 있다.
Trans Abstract
Background
The concept of successful aging (SA) is becoming more emphasized. Since this status can change over time, it is necessary to evaluate the pattern of change and its effect on subjective well-being.
Methods
In this study, the participants aged 65 or older in the Korean longitudinal study of aging (KLoSA) were divided into four groups based on the change in SA (2006-2018), and its relationships with self-rated health and life satisfaction were evaluated.
Results
Compared to the non-SA (NSA)→NSA group, the odds ratio for positive self-rated health was 4.30 (95% confidence interval [CI], 1.64-11.31) in the SA→SA group, 3.92 (95% CI, 1.94-7.95) in the NSA→SA group, and 1.79 (95% CI, 1.28-2.50) in the SA→NSA group. High life satisfaction was 2.42 (95% CI, 1.19-4.94) in the SA→SA group and 2.50 (95% CI, 1.36-4.59) in the NSA→SA group.
Conclusions
Maintenance or improvements of a SA state has a significant association with positive self-rated health and high life satisfaction.
INTRODUCTION
The increase in life expectancy and the aging population are global phenomena, which are posing social, economic and health-related consequences worldwide. In Korea, the proportion of the aged population is expected to increase to 24.5% by 2030 and 41.0% by 2060 [1]. In the field of gerontology, research has been conducted with more attention on “how to age well”, rather than “how to live long.”
Havighurst, who first introduced the concept of successful aging (SA), emphasized the condition under which the individual gets a maximum of satisfaction and happiness without severe costs to some other segment of society [2]. The concept of SA was elaborated in 1980s by Rowe and Kahn [3]. The definition of SA by Rowe and Kahn [3] included following standards; “low probability of disease and disease-related disability and related risk factors”; “high cognitive and physical functional capacity”; and “active engagement with life”. For past decades, a wide variety of definition and measurement of SA have been proposed, and the most frequently used domains were physiological health, physical capabilities, cognitive functions, psychological well-being and social well-being [4].
As SA is multidimensional concept comprising of physical and psychosocial aspects, it is not a fixed, immutable state, but a state that can constantly change through adaptation and development over lifetime [5]. Therefore, it is worth evaluating the change in SA over time and its multi-faceted impact. Majority of previous studies of SA have focused on its clinical outcome, such as longevity or depression [6,7]. However, considering that the aim of SA is to maintain an optimal quality of life and overall well-being, it is necessary to find out how well the SA status reflects and predicts subjective well-being in longitudinal perspective.
Self-rated health and life satisfaction are widely used indicators of subjective health and well-being. Self-rated health is an easily applicable tool to assess self-perceived health, which is closely associated with morbidity and mortality [8]. It has been regarded as a very useful indicator in the field of public health, and it is commonly used in psychosocial and gerontological studies. Life satisfaction is defined as a cognitive assessment of the fit between the desired goals in life and actual life outcomes [9]. The close association of SA and these two measures were documented in a few previous studies. A previous study found that the prevalence of good self-rated health and satisfaction increased with increasing numbers of positive Rowe-Kahn SA dimensions [10]. Yet, to our knowledge, there is scarce literature on the association between chronological change in SA and indicators of subjective health and well-being. The objective of the present study was to evaluate the patterns of change in SA and its components over 12 years and their impact on self-rated health and life satisfaction.
METHODS
1. Sample and study design
The data for this study were derived from 1st (2006) and 7th (2018) waves of the Korean longitudinal study of aging (KLoSA). The KLoSA is a nationwide, longitudinal study aimed to create the basic data needed to implement health and social policies regarding on rapid aging population. Basic survey for KLoSA is conducted every even-numbered year starting from 2006, and the data on demographics, family and social networks, physical and mental health, employment and retirement, income, and wealth were collected by computer-assisted personal interviewing methods. Of the 10,254 participants aged 45 years or older were included in the baseline survey (2006). This study included those who were 65 years or older at 1st wave (n=4,164), and 613 subjects were excluded who had missing values for the study variables: self-rated health, life satisfaction, major illness, activities of daily living (ADL), instrumental activities of daily living (IADL), depression scale, social engagement, mini mental state examination, grip strength. Among 3,551 subjects, 1,834 subjects were lost in follow up. After excluding those with the missing values for the study variables at 2018 (n=539), 1,178 participants were included in this study (Figure 1). When collecting the original data, the trained interviewer notified the subject of informed consent and confidentiality. The data provided were assigned with unique numbers so that personal information was not identified, ensuring the anonymity and confidentiality of the subject. The survey protocol was approved by the Institutional Review Board of Statistics Korea.

Flowchart of study participants from 2006-2018.
2. Definition of SA
Rowe and Kahn’s model has been the most commonly accepted approach to SA. Based on Rowe and Kahn’s model and prior literature, we defined SA as having no major disease, freedom from disability, no depressive symptoms, active social engagement, maintenance of cognitive function, maintenance of physical function. We defined specific six domains consisting SA as follows.
1) No major disease
Four leading causes of death in Korea including cancer, heart disease, cerebrovascular disease, and diabetes were adopted to distinguish SA [11]. Participants were asked whether they had been ever diagnosed with any of these diseases. A successful ager is free of any of them.
2) Freedom from disability
Respondents were classified as successful agers if they had no difficulties in ADL and no more than 1 disability in the IADL. ADL items included dressing, ambulating, feeding, toileting, continence, and personal hygiene; IADL items were transportation, shopping, managing finances, meal preparation, doing laundry and home maintenance, going out for a short distance, manage telephone, and managing medications.
3) No depressive symptoms
Depressive symptoms were assessed with 10-item center for epidemiologic studies- depression scale (CES-D-10), adopted the original 20-item version, which is a brief screening instrument to assess depressive symptoms in older adults [12]. Those with CES-D score less than 4 were regarded as successful agers [13].
4) Active social engagement
Participants were defined as actively engaged when they were currently participating in any of following social activities: religious, leisure/sports, alumni associations, volunteering, political parties, nongovernmental organizations.
5) Maintenance of cognitive function
The Korean Mini Mental State Examination (K-MMSE) was used to differentiate the level of cognitive impairment. K-MMSE scores range from 0 to 30, and participants with a score of 24 or higher were considered as having normal cognitive function.
6) Maintenance of physical function
Handgrip strength was used to evaluate physical function. Successful agers were defined as those with handgrip strength ≥28 kg for men and ≥18 kg for women. The standard values of handgrip strength were derived from the Asian Working Group for Sarcopenia 2014 consensus [14].
3. Self-rated health and life satisfaction
Self-rated health was defined as the response to the question “how do you rate your health status?”. Self-rated health was measured on a 5-point Likert scale, ‘‘very good’’, “good’’, ‘‘fair’’, ‘‘bad’’, and ‘‘very bad’’. Responses with ‘‘very good’’, “good’’ or ‘‘fair’’ were considered as positive self-rated health. Life satisfaction was determined by following questionnaire: “how are you satisfied with your overall quality of life (feeling of happiness) when compared to others in your peer groups?” life satisfaction was measured by 0-100 scale. A rating score 60 or over were regarded as high life satisfaction.
4. Covariates
Covariates of this study included demographics and health behaviors. The demographic variables were age (65-74, 70-74, or ≥75 years); sex; education level (elementary or lower, middle school, high school or above); income (above or below the 50th percentile of yearly household income), marriage (married with spouse present or single including never married, separated, widowed, and divorced), region (rural or urban). Further, health behavior variables included current cigarette smoking, current alcohol consumption, and regular physical activity at least once a week (yes or no). Body mass index was calculated as weight (kg)/height (m2) and classified into underweight (-18.5 kg/m2), normal (18.6-22.9 kg/m2), pre-obese (23.0-24.9 kg/m2), and obese (≥25.0 kg/m2) according to the Asia-Pacific obesity guidelines [15]. As for chronic diseases, following diseases were considered: hypertension, diabetes mellitus, cancer, chronic lung disease, chronic liver disease, heart disease, cerebrovascular disease, mental disorder, arthritis, prostate disease, gastrointestinal disease, herniation of intervertebral disc, and dementia. Also, diagnosis of chronic diseases between the year of 2006 and 2018 was included as covariate.
5. Statistical analysis
IBM SPSS Statistics ver. 25.0 (IBM, Inc., Armonk, NY, USA) was used for data analysis. Chi-square tests were conducted to compare categorical variables of study population. To examine the association between transitions in SA status with self-rated health and life satisfaction, multiple logistic regression models were adopted with adjustment for statistically significant factors. P-value <0.05 was considered statistically significant. Results are presented as an odds ratio (OR) with 95% confidence interval (CI).
RESULTS
1. Distribution of SA and its transition
In 2006, 24.7% (n=291) of the study participants met the criteria for SA, and at the year of 2018, 9.8% (n=116) were classified as successful agers (Figure 2). When the study participants were stratified by types of 12-year transition in SA, 4.2% maintained the status of SA (SA→SA group, n=49) and 20.5% transitioned to non-successful agers (SA→non-SA [NSA] group, n=242). 5.7% were classified as non-successful ager at baseline survey but accomplished SA after 12 years (NSA→SA group, n=67). 69.6% remained in non-successful agers (NSA→NSA group, n=820).

Distribution of successful aging and its transition. (A) Successful aging status of study participants at 2006. (B) Successful aging status followed up at 2018. (C) Transition of successful aging over 12 years. SA, successful aging; NSA, non-successful aging.
Twelve-year-change of each domains consisting SA was further analyzed (Figure 3). Of the total study subjects, 55.8% in ‘absence of major illness’, 80.1% in ‘freedom from disability’, 80.0% in ‘no depressive symptoms’, 46.4% in ‘active social engagement’, 43.0% in ‘maintenance of cognitive function’, and 23.6% in ‘maintenance of physical function’ remained in the criteria for SA in each domain. Except for ‘absence of major illness’, there were subjects who had improvement in domains of SA; 5.9% in ‘freedom from disability’, 5.8% in ‘no depressive symptoms’, 17.2% in ‘active social engagement’, 8.2% in ‘maintenance of cognitive function’, and 11.5% in ‘maintenance of physical function’.
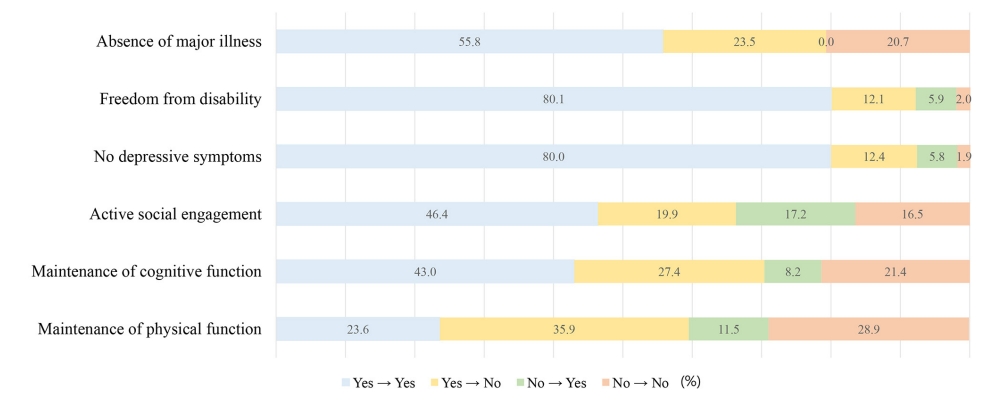
Distribution of transition in domains consisting successful aging.
2. General characteristics and health related behaviors of study participants
Baseline sample characteristics of each group classified by 12-year-transition of SA are described in Table 1. Compared to other groups, those in SA→SA group were likely to be male, young, highly educated, and married. Living in urban and less cormorbidities were also related with ‘SA→SA’. In terms of health-related behaviors, the proportion of current smokers and performing regular exercise were highest in SA →SA group, at the year of 2006 and 2018 (Table 2).

General characteristics at baseline (2006) according to successful aging transition (2006→2018)

Health-related behaviors of participants at 2006 and 2018
3. The relationship between SA transition with self-rated health and life satisfaction
This study analyzed the OR of positive self-rated health and high life satisfaction at 2018 according to types of SA transition over 12 years (Table 3). The adjusted variables were sex, age, education, marriage, region, alcohol drinking, and regular exercise. Based on ‘NSA→NSA group’ as a reference, SA →SA group had the highest OR for reporting self-rated health as ‘fair’, ‘good’, or ‘very good’ (OR, 4.30; 95% CI, 1.64-11.31), followed by NSA→SA group (OR, 3.92; 95% CI, 1.94-7.95) and SA→NSA group (OR, 1.79; 95% CI, 1.28-2.50). In the association between life satisfaction and SA transition, SA→SA group and NSA→SA group are more likely to report high life satisfaction by 2.42-fold and 2.50-fold respectively, compared to NSA→NSA group (95% CI, 1.19-4.94; 95% CI, 1.36-4.59).

Self-rated health and life satisfaction by successful aging transition
Table 4 describes the association of 12-year change in each component of SA status with positive self-rated health and high life satisfaction. All components except ‘absence of major illness’ were significantly related with both self-rated health and life satisfaction. ‘No depressive symptom’, ‘freedom from disability’, and ‘maintenance of cognitive function’ showed greater OR than other domains, both in positive self-rated health and high life satisfaction.
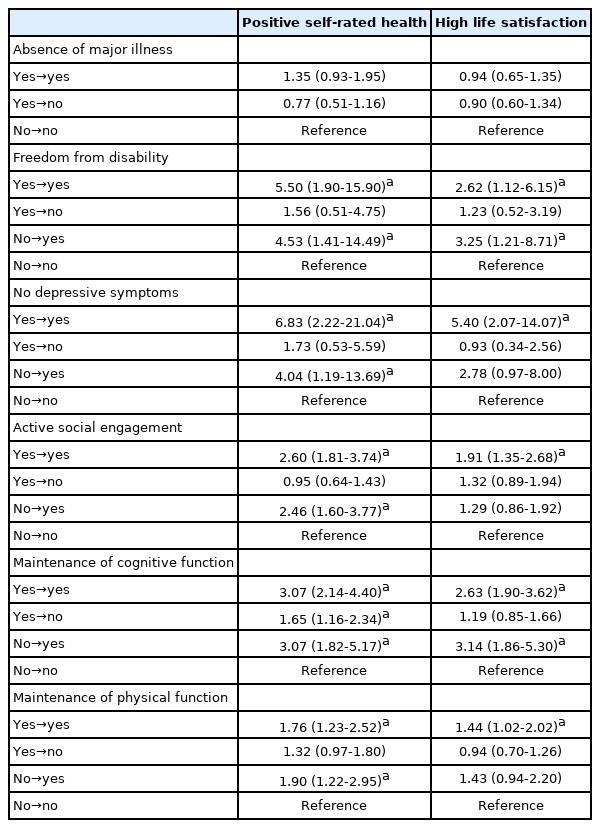
Self-rated health and life satisfaction by in each domains of successful aging
DISCUSSION
Using the analysis of national panel data for Korean older participants, our study presented the 12-year change in the status of SA and its longitudinal association with the indicators of subjective well-being: self-rated health and life satisfaction. Utilizing objective measurement of SA derived from Rowe and Kahn’s model, we found that preserving SA and improving from NSA to SA were related with positive self-rated health and life satisfaction.
According to previous research, the prevalence of SA in South Korea has been reported as 25.2-25.5% [16,17], which were similar to the result of our study (24.7%). When the study subjects were classified based on 12 years of change, the majority were classified as NSA→NSA, followed by SA →NSA. However, there were individuals who maintained SA or even improved to SA status. The distributions of change in satisfying the standards of SA were different for each component. As expected from the natural consequences of aging, there were more participants who experienced negative change than positive change in all domains. Yet, even after long periods, more than 1 out of 10 participants showed improvement in domain of ‘active social engagement’ and ‘physical function’, and more than 1 out of 20 participants showed positive change in domains of ‘cognitive function’, ‘no depressive symptoms’, and ‘freedom from disability’. Aging experience may be an active and dynamic process, encompassing resilience and compensatory strategies in the face of physical and cognitive decline [18].
In the general characteristics of study participants, those who were male, young, highly educated, married, and living in urban likely to maintain the status of SA. This result was consistent with previous studies [5,17]. In this study, alcohol drinking at baseline and follow-up time point was positively associated with initial status of SA. This result may be interpreted in association with previous literature, suggesting that drinking alcohol may indicate the maintenance of social network, which is highly related to a better health of later life in Asian culture [19].
Our finding shows that compared with consistent NSA (NSA→NSA), maintenance of SA (SA→SA) and improvement to SA (NSA→SA) increased the prevalence of positive self-rated health by 4-fold. The transition from SA to NSA also increased the prevalence by nearly 2-fold, implicating that initial status of SA could affect future subjective cognition in health. SA has shown to predict longevity and mortality [20]. Self-rated health, which is strongly associated with morbidity, mortality, and physical functioning [21], could be affected by SA in longitudinal perspective. In terms of life satisfaction, maintenance of SA and improvement to SA were positively correlated with high life satisfaction, and these two transition types showed minimal difference in the OR (2.42 and 2.50). Given that life satisfaction is a cognitive component of subjective well-being correlated with individuals’ perception and interpretation of their current living conditions [22], objective SA measurement reflects the current status of life satisfaction, but may not necessarily predict future psychological well-being, as shown in this study.
All domains except ‘absence of major illness’ showed significant correlation to self-rated health and life satisfaction. The strongest correlates of self-rated health and life satisfaction were ‘depressive symptoms’, ‘freedom from disability’, and ‘maintenance of cognitive function’. Interestingly, in terms of life satisfaction, improvement of functional status and cognitive function (no→yes group) showed greater odds than ‘yes→yes’ group, suggesting the importance of depression correlates with disability, poor global health, diminished self-transcendence, and emotional well-being in later life [23]. It is associated with more negative view on the future and self [24]. Thus, it is not surprising that it strongly affects the self-perception of health and life satisfaction. In the domain of ‘freedom from disability’ Functional capacity is one of the most commonly used criteria for SA in gerontology [25]. Previous studies have described that the functional status in elderly is an important determinant of self-rated health, mortality and quality of life [26,27]. In one study that applied and analyzed several models of SA to different age groups in elderly, the importance of functional capacity in old group (over 75 years old) was more emphasized than young old group (64-74 years old) [20]. In our study, maintenance or improvement of cognitive function affected the prevalence of positive self-rated health and high life satisfaction by 2 to 3 fold. Furthermore, when compared to ‘no→no’ group, ‘yes →no’ group showed 65% higher odds of positive self-rated health, implicating its longitudinal role of initial cognitive function in future subjective health. Cognitive reserve has been a prominent predictor of aging trajectory, which enables the maintenance of function despite age-related physiological change in older subjects [28]. Even mild cognitive impairment has a tendency to negatively affect not only the physical function but also quality of life [29].
Among various definitions and criteria of SA, the Rowe-Kahn model used in our study has been most widely accepted concept. However, previous studies have been criticised this model for being too restrictive, suggesting that when individuals are assessed as succeeding or failing to meet a set of criteria, only a small minority of participants would be classified as SA, while many of whom are satisfied with their life. In an international study, by using objective measures, only 6% of participants were classified as ‘SA’ wheras 65% self-rated as ageing successfully [30]. However, strong positive relationships between objective SA measures and self-reported wellbeing have been reported by previous studies. A study by Whitley et al. [10] showed that all individual positive SA dimensions were related to better self-rated health and satisfaction, regardless of age, gender, and socioeconomic status.
There are limitations to be considered in this study. First, as the data used in this study is consisted of self-reported question, recall bias may have influenced in the accuracy and reliability. Second, there may be differences in SA, self-rated health, and life satisfaction in men and women. Further studies including subgroup analysis are warranted to clarify sex specific relationship between SA and subjective indicators. Third, although the SA model in the study is derived from widely used Rowe and Kahn model and consists of most popular SA domains in gerontology, SA definition as a dichotomy has been criticized in several previous studies. This can be compensated by establishing a more ideal SA criteria in the future, or quantitatively evaluating SA.
In conclusion, we found that self-rated health and life satisfaction are affected by 12-year transition types of SA. It is important to note that to optimize self-rated health and life satisfaction in older people, clinical interventions for individuals or policies should enhance the maintenance and improvement of SA domains. Absence of depressive symptoms had highest OR for both positive self-rated health and high life satisfaction. Maintenance and improvements in functional capacity and cognitive function can greatly affect life satisfaction. Constant efforts to prevent depressive symptoms, maintain and improve the functional capacity and cognitive function are especially emphasized.