Equol Production and Increased Leukocyte Mitochondrial DNA in Postmenopausal Women
Article information
Abstract
Background
Equol, a metabolite of diadzein, is produced by some intestinal bacteria. Equol acts as an estrogen receptor agonist and has been reported to have several beneficial health effects. Leukocytes play an important role in the pathogenesis of autoimmune, metabolic, and cardiovascular diseases. Decreased leukocyte mitochondrial DNA (mtDNA) content, as an index of mitochondrial function, is associated with metabolic syndrome, bone mineral density, and aging. The possible association between equol production and leukocyte mitochondrial function has not been studied to date. Therefore, we investigated whether equol production is associated with leukocyte mtDNA copy number in postmenopausal women.
Methods
This observational cross-sectional study included 71 postmenopausal women. They completed a lifestyle questionnaire and medical history. In addition, a dietary assessment using a 24-hour recall method and food frequency questionnaire, anthropometric evaluation, and blood sampling were conducted. Serum equol concentration was measured in the fasting state. Leukocyte mtDNA copy number was measured by real-time polymerase chain reaction.
Results
Among older females, 33.8% were equol producers. The leukocyte mtDNA copy number was lower in non-equol producers versus equol producers. Furthermore, the leukocyte mtDNA copy number was positively associated with the serum equol concentration (r=0.42, P<0.01). Stepwise multiple regression analysis showed that equol production (β=47.864, P<0.01) was an independent factor associated with mtDNA copy number.
Conclusions
Equol production was associated with elevated mtDNA content in the peripheral blood of postmenopausal women. This finding suggests that the beneficial health effects of equol in postmenopausal women may be related to increased mitochondrial function.
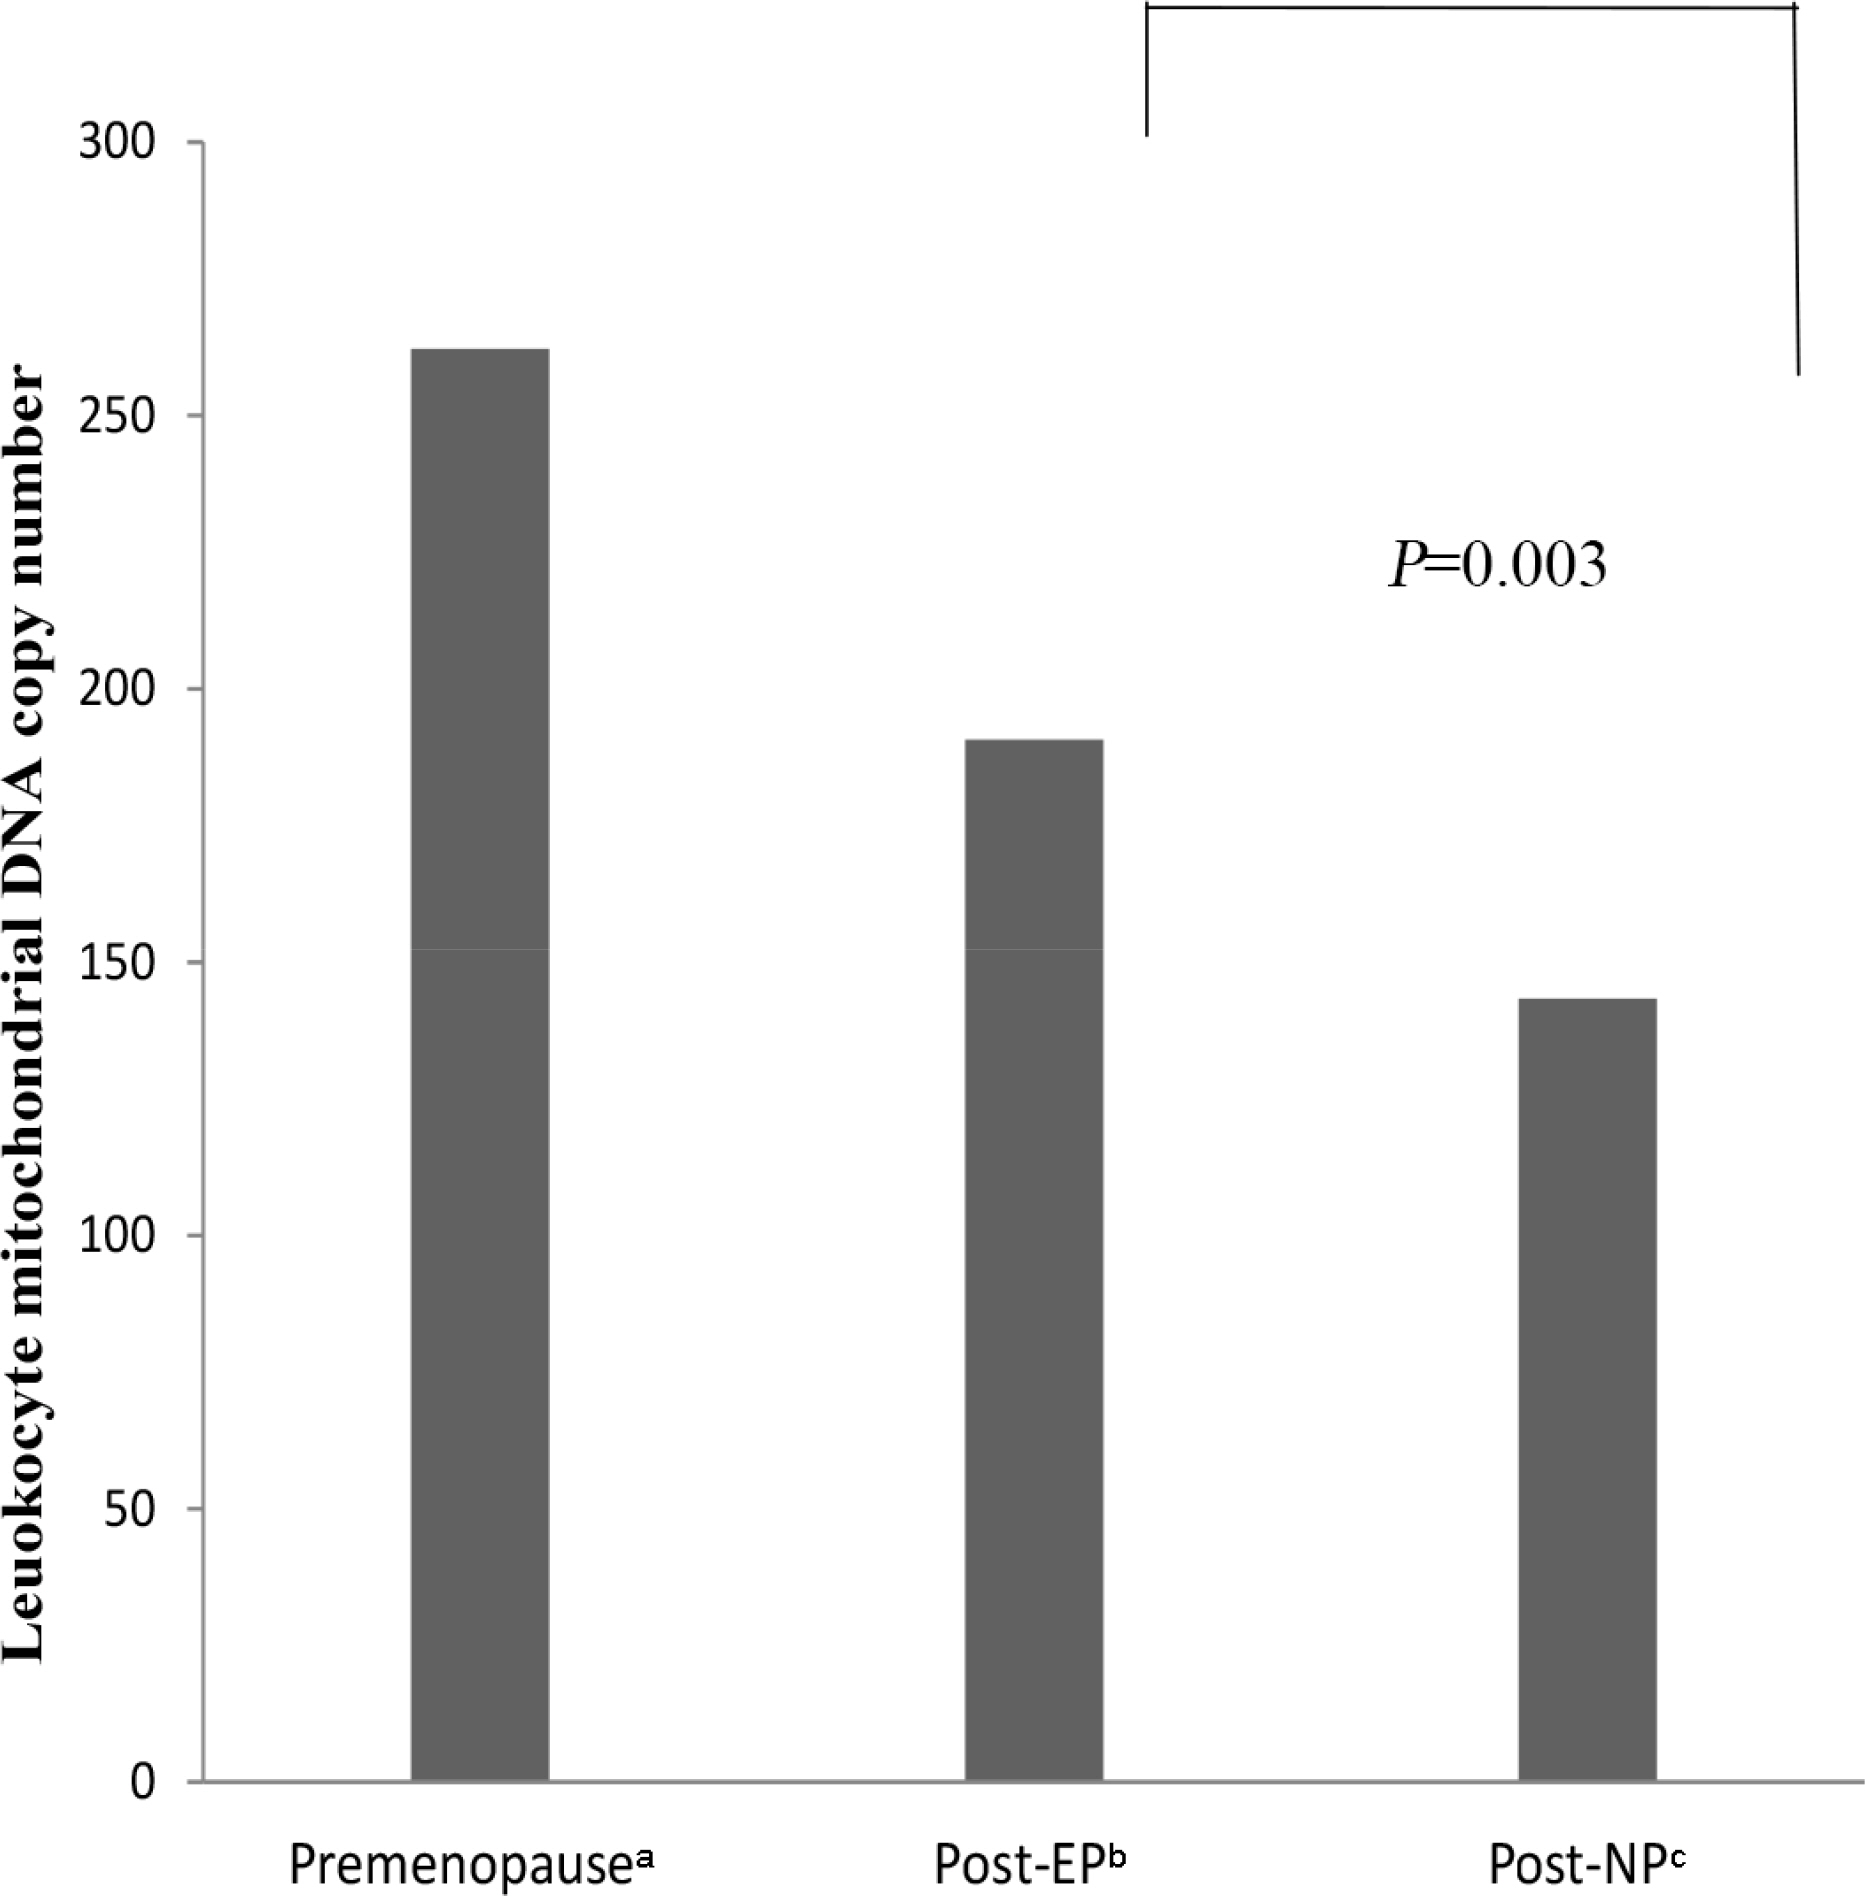
Leukocyte mitochondrial DNA copy number among premenopausal women, postmenopausal equol producers, and postmenopausal non-equol producers. Premenopausal women: 262.21 (50.04); postmenopausal equol producers: 190.72 (29.19); and postmenopausal non-equol producers: 143.36 (26.58). P-values were calculated using ANCOVA for adjustment of age. aPremenopausal women; bPostmenopausal equol producer women; cPostmenopausal non-equol producer women.

Association between leukocyte mitochondrial DNA copy number and serum equol concentrations. P-values were calculated by Pearson’s correlation.


Stepwise multiple linear regression analysis to identify independent clinical variables associated with leukocyte mitochondrial DNA copy number