


INTRODUCTION
Cardiovascular diseases refer to a class of abnormal conditions related heart or blood vessels and include hypertension, ischemic heart disease, myocardial infarction, ischemic stroke, and arrhythmia. As low-density lipoprotein (LDL) cholesterol is known as a strong predictor of the risk of cardiovascular diseases, lowering LDL cholesterol level is recommended for the prevention and management of cardiovascular disease [1]. On the other hand, high-density lipoprotein (HDL) cholesterol is considered as an anti-atherogenic factor in the development of cardiovascular diseases [1]. Therapy methods for the treatment of cardiovascular disease are usually determined based on the LDL cholesterol level, along with other cardiovascular risk factors.
To reduce LDL cholesterol level, low-fat diets, especially those low in saturated fatty acids and trans fats, are typically prescribed [1]. Several meta-analyses of randomized controlled trials have shown that low-fat diets involving carbohydrate replacement had more favorable effects on total cholesterol and LDL cholesterol levels than high-fat diets [2-4]. On the other hand, low-fat diets had less effect on HDL cholesterol or triglyceride levels compared to high-fat diets [4]. Adhering to low-fat diets also resulted in elevated triglyceride levels [2].
Recent studies have revealed that elevated triglycerides and low HDL cholesterol independently affect the development of cardiovascular disease, even in the absence of high LDL cholesterol level [5,6]. Observational studies have reported that high-carbohydrate, low-fat diets are consistently associated with elevated triglycerides and low HDL cholesterol levels [7-10]. Consequently, the high carbohydrate intake might also lead to increased risks for cardiovascular disease, metabolic syndrome, and type 2 diabetes [11-14].
The Korean population typically consumes high-carbohydrate diets with low fat intake (65% carbohydrates vs. 20% fat). Since cardiovascular disease is one of the major causes of death in Korea [15], investigating the associations between dietary carbohydrate intake and cardiovascular risk factors by LDL cholesterol level is necessary to develop specific dietary guidelines for reducing cardiovascular disease risks. Therefore, the purpose of the present study was to examine the association between dietary carbohydrate intake and cardiovascular risk factors by LDL cholesterol level in Korean adults using nationwide representative samples.
METHODS
1. Data and subjects
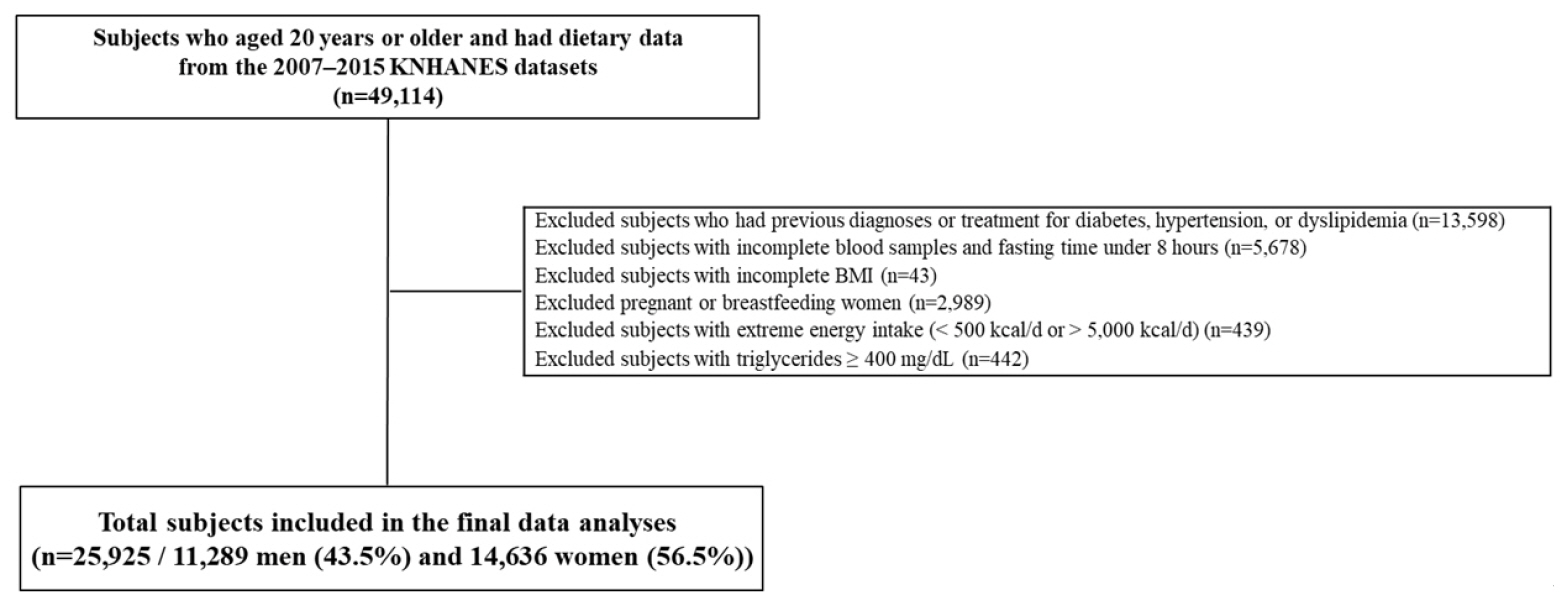
This study used the 2007-2015 Korea National Health and Nutrition Examination Surveys (KNHANES) data. The KNHANES is a cross-sectional and nationwide representative representative survey performed to assess and monitor the nutritional health status of the Korean population [16]. The KNHANES uses a stratified, multi-stage probability sampling method and includes three parts: a health interview, physical examination and laboratory test, and nutritional survey [16]. Of the 49,114 subjects who were aged 20 years or older and had dietary data, several were excluded because they had a previous diagnosis or treatment for hypertension, dyslipidemia, or diabetes (n=13,598); had incomplete blood samples or fasting time under 8 hours (n=5,678); had no information on body mass index (BMI; n=43); were pregnant or breastfeeding (n=2,989); or reported implausible energy intake (<500 kcal/day or >5,000 kcal/day; n=439). In addition, subjects who had triglyceride levels ‚Č•400 mg/dL were excluded for the calculation of LDL cholesterol level (n=442). A total of 25,925 adults (11,289 men and 14,636 women) were included in the final data analyses. Figure 1 shows the flow of study subjects selection. The our study was conducted in accordance with the Declaration of Helsinki. The study protocol was approved by the Institutional Review Board of the Korea Centers for Disease Control and Prevention (2007-02CON-04-P, 2008-04EXP-01-C, 2009-01CON-03-2C, 2010-02CON-21-C, 2011-02CON-06-C, 2012-01EXP-01-2C, 2013-07CON-03-4C, 2013-12EXP-03-5C). Written informed consent was obtained from each subject.
2. Dietary variables
Total energy and macronutrient intake was assessed using data from 1 day 24-hour dietary recall for each subject. The 24-hour dietary recall data were obtained by trained interviewers during the nutrition survey in a manner of representing weekdays and weekends. Intakes of total energy and macronutrient were calculated based on a food composition table published by the Rural Development Administration of Korea [17,18]. Macronutrient intakes were also presented as proportions of total energy intake. To evlaute carbohydrate and fat intake, the acceptable macronutrient distribution range from the 2015 dietary reference intakes for Koreans was used: the acceptable macronutrient distribution range for carbohydrate is 55-65% and fat is 15-30% in adults [19].
3. Anthropometric and biochemical variables
During the health examination, anthropometric and biochemical variables were measured by trained medical personnel. BMI was calculated based on the measured heights and weights (kg/m2). Waist circumference was measured at the umbilical level for each subject in a standing position using a measuring tape. Blood pressure was measured three times, and the average of the last two values was used.
Fasting blood samples were collected from each subject who had at least 8 hours of fasting time. Total cholesterol, HDL cholesterol, triglycerides, and fasting blood glucose were analyzed in a certified clinical laboratory using an ADVIA 1650 (Siemens, Tarrytown, NY, USA) for samples collected between 1 January 2007 and 15 February 2008 and a Hitachi automatic analyzer 7600 (Hitachi, Tokyo, Japan) for samples collected after 20 February 2008. LDL cholesterol was calculated using Friedwald’s equation as total cholesterol - (triglycerides / 5) - HDL cholesterol [20].
4. Cardiovascular risk factors
Cardiovascular risk factors included in this study were obesity, metabolic syndrome, type 2 diabetes, and dyslipidemia (e.g., hypercholesterolemia, hypertriglyceridemia, and atherogenic dyslipidemia). According to the World Health Organization Western Pacific region classification, subjects who had BMI ‚Č•25 kg/m2 were considered to have obesity [21]. The presence of metabolic syndrome was determined as subjects had three or more of the metabolic syndrome components according to the National Cholesterol Education Program Adult Treatment Panel III criteria [1]: 1) abdominal obesity (‚Č•90 cm in men, ‚Č•85 cm in women), which used a modified waist circumference cutoff for Korean adults [22], 2) elevated triglycerides (‚Č•150 mg/dL), 3) reduced HDL cholesterol (<40 mg/dL in men, <50 mg/dL in women), 4) elevated blood pressure (systolic blood pressure ‚Č•130 mmHg or diastolic blood pressure ‚Č•85 mmHg), and 5) elevated fasting blood glucose (‚Č•100 mg/dL). Type 2 diabetes was defined as fasting blood glucose ‚Č•126 mg/dL. Hypercholesterolemia was defined as total cholesterol ‚Č•240 mg/dL for individuals with LDL cholesterol ‚Č•130 mg/dL and total cholesterol ‚Č•200 mg/dL for individuals with LDL cholesterol <130 mg/dL, and hypertriglyceridemia was diagnosed as triglycerides ‚Č•200 mg/dL [1]. Subjects who had both elevated triglycerides and reduced HDL cholesterol were considered to have atherogenic dyslipidemia [23]. LDL cholesterol level was divided into two groups: <130 mg/dL or ‚Č•130 mg/dL.
5. Other variables
Sociodemographic and lifestyle variables were collected using a structured questionnaire during the health interview part. Sociodemographic variables included sex, age, education, household income, and residence. Lifestyle variables included current smoking status, current alcohol drinking, and physical activity. Current smoking status was designated as a ‚Äúyes‚ÄĚ if a subject had smoked more than 100 cigarettes during their lifetime and were smoking regularly or occasionally. Current alcohol drinking was determined as a ‚Äė‚Äėyes‚Äô‚Äô if a subject drank a glass of alcohol or more per month over the previous year. Physical activity was assessed as a ‚Äė‚Äėyes‚Äô‚Äô if a subject engaged in walking for 30 minutes or more on at least 5 days during the previous week.
6. Statistical analyses
All statistical analyses were performed using the Statistical Analysis Systems (SAS) software package, version 9.4 (SAS Institute, Cary, NC, USA). All of the analyses accounted for the complex sampling design effect and used appropriate sampling weights to obtain estimates of the entire Korean adult population from the representative survey sample. Continuous variables were expressed as means with standard errors and categorical variables were expressed as percentages. The t-test was used to test statistical differences in continuous variables by sex and the Rao-Scott chi-square test was used to test statistical differences in categorical variables by sex. Differences in cardiovascular risk factors and dietary variables between LDL cholesterol groups were tested using the regression analysis after adjustment for covariates. Dietary carbohydrate intake was grouped into quintiles by sex. A multiple logistic regression model was used to calculate odds ratios (ORs), 95% confidence intervals (CIs), and P for trends for cardiovascular risk factors across quintiles of dietary carbohydrate intake by sex and LDL cholesterol level. Confounding variables considered in the statistical models were age, residence, education, household income, current smoking status, current alcohol drinking, physical activity, BMI, and total energy intake. Any test of significance which was conducted in this study was two-tailed, and a P-value of <0.05 was considered statistically significant.
RESULTS
1. Characteristics of the study subjects by sex
Table 1 shows the characteristics of the study population by sex. Men were more likely than women to be older, live in rural areas, currently smoke and currently drink alcohol, and do physical activity. Men had higher BMI, waist circumference, total cholesterol, triglycerides, LDL cholesterol, systolic and diastolic blood pressure, and fasting blood glucose, but a lower level of HDL cholesterol than women (P<0.001).
2. Macronutrient intake by LDL cholesterol level
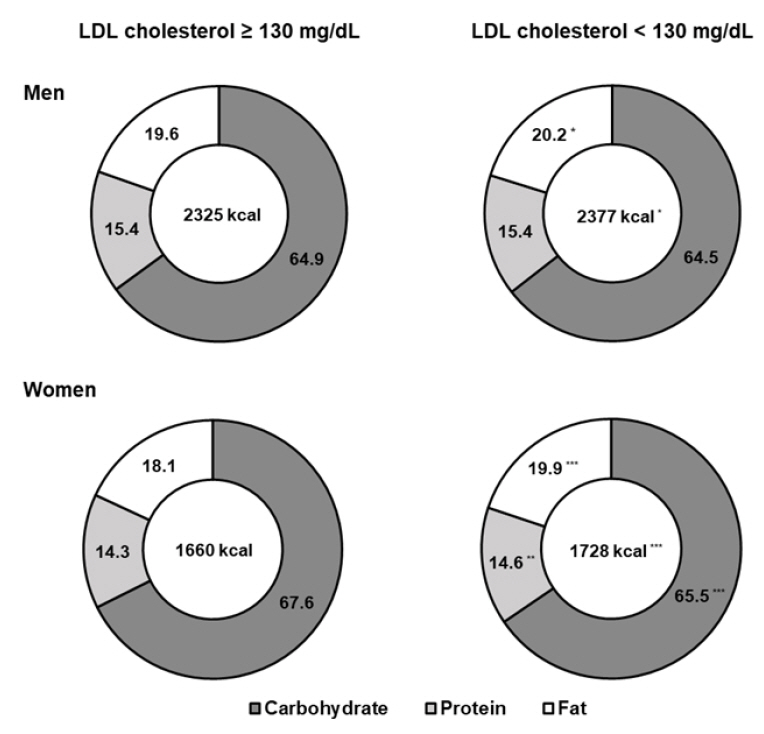
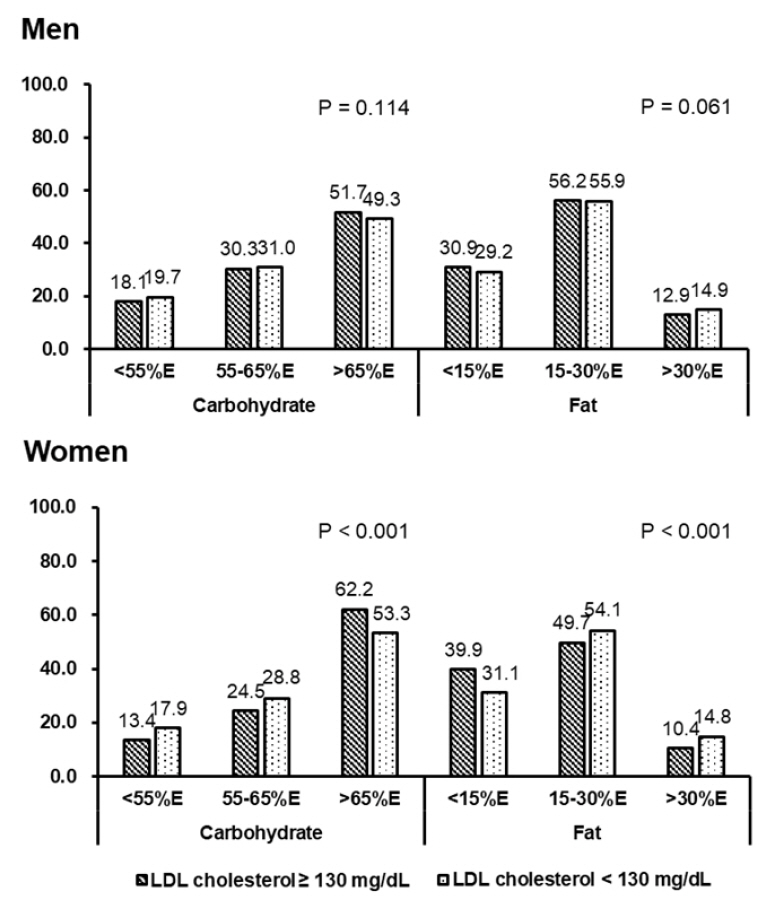
Energy and macronutrient intakes by sex and LDL cholesterol level are shown in Figure 2. Among men, subjects with LDL cholesterol ‚Č•130 mg/dL consumed significantly less energy and fat than those with LDL cholesterol <130 mg/dL. Women with LDL cholesterol ‚Č•130 mg/dL had a higher carbohydrate intake but lower energy, fat, and protein intakes compared to those with LDL cholesterol <130 mg/dL. Among women, the percentage of subjects who consumed more than the recommended level of carbohydrates (65% of energy) was higher in the higher LDL cholesterol group than the lower LDL cholesterol group (65.2% vs. 53.3%, P<0.001). The proportion of women who consumed more than the recommended level of fat (>30% of energy) was lower in the higher LDL cholesterol group compared to those in the lower LDL cholesterol group (10.4% vs. 14.8%, P<0.001) (Figure 3).
3. Cardiovascular risk factors by LDL cholesterol level
Table 2 presents the mean values of cardiovascular risk factors by sex and LDL cholesterol level. In both men and women, subjects with LDL cholesterol ‚Č•130 mg/dL had higher levels of BMI, waist circumference, total cholesterol, triglycerides, systolic and diastolic blood pressure, and fasting blood glucose, but lower levels of HDL cholesterol, than subjects with LDL cholesterol <130 mg/dL.
4. Association between dietary carbohydrate intake and cardiovascular risk factors by LDL cholesterol level in men
Table 3 presents the association between dietary carbohydrate intake and cardiovascular risk factors by LDL cholesterol in men. Among men with LDL cholesterol ‚Č•130 mg/dL, dietary carbohydrate intake was positively associated with reduced HDL cholesterol and atherogenic dyslipidemia, but inversely associated with increased waist circumference. Among men with LDL cholesterol level <130 mg/dL, high carbohydrate intake was linked to increased prevalence of low HDL cholesterol and atherogenic dyslipidemia. Other cardiovascular risk factors were not related to carbohydrate intake in either LDL cholesterol group.
5. Association between dietary carbohydrate intake and cardiovascular risk factors by LDL cholesterol level in women
In women with LDL cholesterol <130 mg/dL, high carbohydrate intake was associated with increased prevalence of reduced HDL cholesterol but decreased prevalence of hypercholesterolemia. Women with LDL cholesterol ‚Č•130 mg/dL did not exhibit any association between dietary carbohydrate intake and cardiovascular risk factors (Table 4).
DISCUSSION
The current study on Korean adults examined the association between dietary carbohydrate intake and cardiovascular risk factors according to LDL cholesterol levels (<130 mg/dL and ‚Č•130 mg/dL). We observed that a high dietary carbohydrate intake was associated with increased prevalence of atherogenic dyslipidemia or low HDL cholesterol, regardless of LDL cholesterol levels.
Dietary guidelines for reducing cardiovascular disease risk have traditionally focused on decreasing dietary total fat and saturated fatty acids to address high LDL cholesterol levels. However, previous randomized controlled trials and cohort studies have shown that replacing saturated fat with carbohydrate increases the risk of cardiovascular disease [2-4,24-26]. It is well known that high-carbohydrate diets are associated with cardiovascular risk factors, such as hypertriglyceridemia, low HDL cholesterol, and elevated blood glucose, resulting in an increased risk for cardiovascular disease.
In the current study, regardless of LDL cholesterol level, high-carbohydrate diets were associated with low HDL cholesterol and atherogenic dyslipidemia, which is consistent with the results of other studies. The prospective urban rural epidemiology (PURE) study, a large international observational study conducted in 18 countries, reported that high carbohydrate intake had unfavorable relationships with lipid parameters, including triglycerides, HDL cholesterol, ratio of total cholesterol to HDL cholesterol, and ratio of triglycerides to HDL cholesterol, except for total cholesterol and LDL cholesterol [27]. This study also showed that replacing saturated fats with carbohydrates was linked to the most adverse effects on lipid profiles [27]. Since Frost et al. [28]. had reported that glycemic index of the diet had significant inverse relation with serum HDL cholesterol levels in British adults, several studies reported the consistent findings on the inverse association between carbohydrate intake and HDL cholesterol in USA, Indian, Korean adults [7,8,29,30]. Although the mechanism of the inverse association between carbohydrate intake and HDL-cholesterol has not been fully elucidated, it has been explained that carbohydrate may involve the synthesis and catabolism of HDL [7,31]. Other epidemiologic studies have also demonstrated that high dietary carbohydrate intake is associated with increased risk of coronary heart disease and metabolic syndrome, which may be explained by increased levels of triglycerides and blood glucose and reduced levels of HDL cholesterol [11,14].
Recently, the long-term effect of carbohydrate intake on mortality was explored. A large prospective cohort study and meta-analysis including the PURE study demonstrated that carbohydrate intake had a U-shaped association with mortality, and minimal mortality risk was observed at 50-55% of energy from carbohydrate intake [32]. A carbohydrate intake of 50-55% is regarded as a low-carbohydrate diet in Korea. In this study, the proportion of the population who consumed less than 55% of energy from carbohydrate was approximately 18% while those who consumed more than 65% of energy from carbohydrate was more than half of the population regardless of LDL cholesterol levels. According to the 2018 guidelines for the management of dyslipidemia in Korea, total fat intake is recommended to be less than 30% and saturated fat intake to be less than 7% of total energy [33]. The current study showed that the proportion of the population who consumed more than 30% total fat was only 14.8% in those with LDL cholesterol level <130 mg/dL. It was even lower in those with LDL cholesterol level ‚Č•130 mg/dL: 12.9% in men and 10.4% in women. It may be presumed that dietary strategies lowering fat intake are still applied more widely than strategies optimizing macronutrient intake in the prevention and management of cardiovascular disease in Korean adults, although no data on saturated fat intake were available in this study owing to the incomplete fatty acid database.
Koreans should be careful about very high carbohydrate intake. The major sources of dietary carbohydrate in Korea include white rice as a staple food, as well as noodles, bread, and rice cakes, which are also frequently consumed. As a result, Korean adults show a high glycemic index and glycemic load in their diet [34]. Higher intake of dietary carbohydrate, including white rice, is linked with lower consumption of meat, fish, egg, beans, and dairy products [11]. Therefore, it may contribute to lower fat, vitamin, and mineral intake. Several Korean studies have demonstrated an adverse effect of high-carbohydrate diets on metabolic diseases, including metabolic syndrome, dyslipidemia, and type 2 diabetes [11,35]. Using the data from the Korean Genome and Epidemiology Study, Ha et al. [35] reported that unbalanced macronutrient composition increased the risk for type 2 diabetes.
We found that women with <130 mg/dL of LDL cholesterol were more likely to have high carbohydrate intake and low HDL cholesterol, but less likely to have hypercholesterolemia. Epidemiologic studies in Asian populations consistently report that dietary carbohydrate intake is positively associated with triglycerides and HDL cholesterol, and inversely associated with total cholesterol and LDL cholesterol [8,9]. Although high-carbohydrate diets have favorable effects on total cholesterol and LDL cholesterol level, reduced HDL cholesterol and hypertriglyceridemia can also be strong predictors of cardiovascular disease with or without an elevated LDL cholesterol level [5,6]. The effect of increasing HDL cholesterol and decreasing triglycerides levels by restricting dietary carbohydrate intake on cardiovascular disease risk has not yet been determined among Korean adults with high-carbohydrate, low-fat diets.
The findings of the present study suggest that dietary recommendations on macronutrients should be made according to individuals’ nutrient and serum lipid profiles. In particular, dietary carbohydrate and fat intakes have a reciprocal relationship and, thus, overall macronutrient composition should be considered in dietary guidelines for cardiovascular disease. Current dietary recommendations have been developed based on dietary characteristics of Western populations, whose dietary fat intake is relatively high compared to that of Asian populations. As Asian populations, typically, have a high-carbohydrate diet, more specific guidelines in terms of the amount, type, and source of dietary carbohydrates are required.
Our study had several limitations. As the results of this study were obtained from a cross-sectional data, it is difficult to draw a causal relationship between diet and disease. Dietary data were based on a single 24-hour dietary recall and thus may not represent an individual’s usual dietary intake. Unmeasured residual confounding variables might be existed. To our knowledge, however, this is the first study to investigate the association between dietary carbohydrate intake and cardiovascular risk factors by LDL cholesterol levels in Asian adults who consume high carbohydrate diets. In addition, this study only included relatively healthy adults who did not have diabetes, hypertension, or dyslipidemia, to remove any effect of disease on their diet.
In conclusion, high carbohydrate intake is associated with increased risk of atherogenic dyslipidemia and low HDL cholesterol regardless of LDL cholesterol level in Korean men. Among Korean women, high-carbohydrate diets are positively associated with low HDL cholesterol but negatively associated with hypercholesterolemia in individuals with LDL cholesterol <130 mg/dL. Dietary recommendations on macronutrient intake for the prevention and management of cardiovascular disease should be suggested based on lipid profiles of individuals along with a consideration of LDL cholesterol level. Future studies are needed to identify the effects of different macronutrient ratios on blood lipid profiles using a clinical trial design. Furthermore, the association between macronutrient composition and cardiovascular events should be examined in prospective cohort studies.
 PDF Links
 PubReader
 ePub Link
 Full text via DOI
 Download Citation
 Print
Print