

| Korean J Health Promot > Volume 19(1); 2019 > Article |

|
Tel: +82-42-629-7653, Fax: +82-42-629-8402, jig1229@hanmail.net
ABSTRACT
Background
Methods
Results
REFERENCES
Figure 1
Experimental procedures.
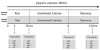
Figure 2
Correlation between changes in mean flow velocity of middle cerebral artery (MCA) and changes in Beta activity for resting 15 minutes after hypoxic exposure. P values are calculated by Pearson correlation analysis. r represents a negative correlation of changes in mean flow velocity of MCA and changes in Beta activity.
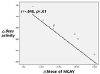

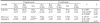
Table 2
Changes of cerebral blood flow velocity in the middle cerebral artery
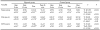
Values are presented as mean±standard deviation.
F values are calculated by two-way repeated-measures ANOVA.
Abbreviations: EDV, maximum end-diastolic velocity; G, group; Mean, mean flow velocity; Peak, peak systolic velocity; T, time.
aSignificantly different from rest (P<0.05).
bSignificantly different from control group (P<0.05).
cSignificantly different from control group (P<0.01).
dSignificantly different from control group (P<0.001).
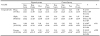
Table 4
Changes of arterial oxygen saturation and heart rate
Values are presented as mean±standard deviation.
F values are calculated by two-way repeated-measures ANOVA.
Abbreviations: G, group; SaO2, arterial oxygen saturation; T, time.
aSignificantly different from rest (P<0.05).
bSignificantly different from control group (P<0.05).
cSignificantly different from control group (P<0.01).
dSignificantly different from control group (P<0.001).
 PDF Links
 PubReader
 ePub Link
 Full text via DOI
 Download Citation
 Print
Print


-
METRICS

-
- 4 Crossref
- 0 Scopus
- 1,769 View
- 1 Download
- Related articles
- Editorial Office
-
Department of Family Medicine, Asan Medical Center, 88, Olympic-ro 43-gil, Songpa-gu, Seoul 05505, Korea
Tel: +82-2-3010-3820 Fax: +82-2-3010-3815 E-mail: kshpdp@amc.seoul.kr
Copyright © 2026 by Korean Society For Health Promotion And Disease Prevention.
