Warning: mkdir(): Permission denied in /home/virtual/lib/view_data.php on line 81

Warning: fopen(upload/ip_log/ip_log_2024-11.txt): failed to open stream: No such file or directory in /home/virtual/lib/view_data.php on line 83

Warning: fwrite() expects parameter 1 to be resource, boolean given in /home/virtual/lib/view_data.php on line 84

Warning: DOMDocument::load(): xmlns:xlink: 'http://www.bokjiro.go.kr/data/statusViewdo?board_sid=297&data_sid=6129473&pageIndex=1&pageUnit=10&searchSort=REG_DESC' is not a valid URI in /home/virtual/healthpro/xmls/kjhp-14-50.xml, line: 105 in /home/virtual/lib/class.pubreader.php on line 51
The Effects of Oral Health on Activity of Daily Living, Depression and Quality of Life in Elderly Women

The Effects of Oral Health on Activity of Daily Living, Depression and Quality of Life in Elderly Women

Article information

Korean J Health Promot. 2014;14(2):50-58
Publication date (electronic) : 2014 January 20
doi : https://doi.org/10.15384/kjhp.2014.14.2.50
1Department of Nursing Science, College of Health Science, Sun Moon University, Asan, Korea
2School of Public Health, Indiana University Bloomington, Bloomington, IN, USA
Corresponding author:Chunmi Kim, PhD Department of Nursing Science, College of Health Science, Sun Moon University, 221 beon-gil 70, Seonmun-ro, Tangjeong-myeon, Asan 336-708, Korea Tel: +82-41-530-2742, Fax: +82-41-530-2725 E-mail: spring4cmk@gmail.com
Received 2014 May 10; Accepted 2014 June 20.

Abstract

Abstract

Background

Although oral health in the elderly significantly affects their physical health and quality of life, there have only been limited studies on the relationship between oral health and quality of life. Thus, the purpose of this study was to examine the relationships between oral health, ADL, depression and quality of life in the elderly in Korea, and to provide data to assist the development of health promotion programs in this population.

Methods

Study subjects included 201 community dwelling elders recruited during December 1 to 31, 2013. Data collected included socio-demographics, oral health (OHIP-14), activity of daily living (ADL), depression status (GDS-SF) and quality of life (QOL). For data analysis, ANOVA test, t‐test, Pearson correlation coefficient and multiple regression analysis were performed using the SPSS 20.0 and AMOS 20.0.

Results

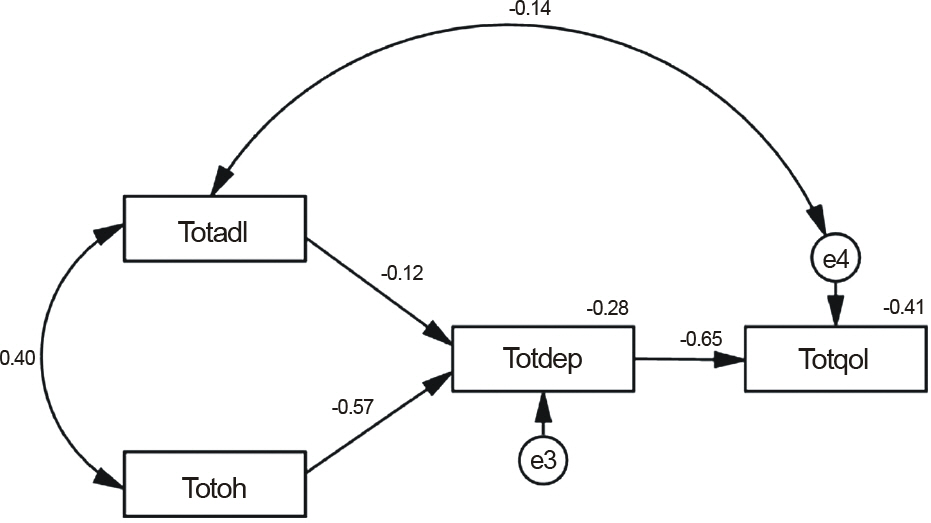
Average score of OHIP was 0.71, depression was 6.34 and QOL was 2.12. There were significant differences in OHIP according to education (F=7.49, P=0.001), economic status (F=4.08, P=0.018) and disease staus (F=3.08, P=0.048). Also there were statistically significant differences in the depression status according to education (F=7.49, P=0.001) and economic status (F=4.08, P=0.018), and in QOL according to education (F=7.01, P=0.001), economic status (F=4.87, P=0.009) and disease (F=11.04, P<0.001). ADL influenced OHIP and depression, OHIP influenced depression and depression influenced QOL.

Conclusions

Oral health in the elderly should be considered in developing health programs for quality of life.

Figure 1

Regression model of variables (Standardized regression weights)

Oral health impact profile according to general characteristics of study participantsa

Differences in ADL, depression, and quality of life according to the characteristicsa

Correlations between general characteristics, activity of daily living, oral health impact profile, depression, and quality of lifea

Parameter statistics in hypothetical modela

References

1. Kang SY, Park IH. Construction of a model of quality of life in longevity region dwelling elders. J Korean Acad Community Health Nurs 2013;24(3):302–13.
2. Kim HK, Lee HJ, Park SM. Factors influencing quality of life in elderly women living alone. J Korean Gerontol Soc 2010;30(2):279–92.
3. Lin QL, Kim HK, Ann JS. Relationship between depression and quality of life in elderly women living alone: the moderating and mediating effect of social support and social activity. J Korean Gerontol Soc 2011;31(1):33–47.
4. Nam KM, Jung EK. The influence of social activity and social support perceived by elderly women living alone on their quality of life: focusing on the mediating effect of depression and death-anxiety. J Welf Aged 2011;52:325–48.
5. Ministry of Health & Welfare, Korean Centers for Disease Control & Prevention. Korea Health Statistics 2012: Korea National Health & Nutrition Examination Survey (KNHANES V-3) [Internet] Seoul: Ministry of Health & Welfare; 2013. [Accessed July 4 2014]. http://www.bokjiro.go.kr/data/statusViewdo?board_sid=297&data_sid=6129473&pageIndex=1&pageUnit=10&searchSort=REG_DESC.
6. Lee KE, Yom YH, Kim SS, Han JH. Gender differences in oral health literacy related factors among elderly people. J Korean Acad Community Health Nurs 2014;25(1):54–64.
7. Koshino H, Hirai T, Ishijima T, Tsukagoshi H, Ishigami T, Tanaka Y. Quality of life and masticatory function in denture wearers. J Oral Rehabil 2006;33(5):323–9.
8. Yamaga E, Sato Y, Minakuchi S. A structural equation model relating oral condition, denture quality, chewing ability, satisfaction, and oral health-related quality of life in complete denture wearers. J Dent 2013;41(8):710–7.
9. Jensen PM, Saunders RL, Thierer T, Friedman B. Factors associated with oral health–related quality of life in community-dwelling elderly persons with disabilities. J Am Geriatr Soc 2008;56(4):711–7.
10. Slade GD. Assessing change in quality of life using the Oral Health Impact Profile. Community Dent Oral Epidemiol 1998;26(1):52–61.
11. Back JU. The effect of oral health on total health and quality of life between Korean and Japanese. Korean Public Health Res 2012;38(1):81–98.
12. Park MS, Choi-Kwon S. The effects of oral care education on caregivers'knowledge, attitude, & behavior toward oral hygiene for elderly residents in a nursing home. J Korean Acad Nurs 2011;41(5):684–93.
13. Han JH, Yom YH. Effects of eating habits, activities of daily living and health behaviors on oral health related-quality of life in elderly persons. J Korean Acad Fundam Nurs 2012;19(2):179–89.
14. Lee GR. The impact of DMFT index on oral health related quality of life in community-dwelling elderly. J Korean Acad Dent Health 2008;32(3):396–404.
15. Park JR, Kim HJ. The effect of need of oral health management to oral health impact profile among elderly over 65 years. J Korean Soc Dent Hyg 2011;11(6):961–71.
16. Yoon HS. Influence of oral health status on oral health related quality of life (OHIP-14) among elderly people in Busan. J Korean Soc Dent Hyg 2013;13(5):759–67.
17. Lee HS, Kim CM. Effect of oral health impact profile (OHIP) on depression and quality of life among community-dwelling Korean elderly persons. J Korean Acad Community Health Nurs 2012;23(3):338–46.
18. Slade GD. Derivation and validation of a short-form oral health impact profile. Community Dent Oral Epidemiol 1997;25(4):284–90.
19. Won CW. Korea activities of daily living scale and Korea instrumental activities of daily living scale. J Korean Geriatr Soc 2002;6(1):1–10.
20. Sheikh JI, Yesavage JA. 9/Geriatric depression scale (GDS): recent evidence and development of a shorter violence. Clin Gerontol 1986;5(1–2):165–73.
21. Lee HS, Kim DG, Ko HJ, Ku HM, Kwon UJ, Kim JH. The standardization of 「geriatric quality of life scale」. Korean J Clin Psychol 2003;22(4):859–81.
22. Miura H, Yamasaki K, Morizaki N, Moriya S, Sumi Y. Factors influencing oral health-related quality of life (OHRQoL) among the frail elderly residing in the community with their family. Arch Gerontol Geriatr 2010;51(3):e62–5.
23. CatovićA. Bergman V, CatićA . Qualitative evaluation of elderly home residents' fixed and removable prostheses in relation to the ADL index. J Dent 2003;31(1):3–8.
24. Naito M, Kato T, Fujii W, Ozeki M, Yokoyama M, Hamajima N, et al. Effects of dental treatment on the quality of life and activities of daily living in institutionalized elderly in Japan. Arch Gerontol Geriatr 2010;50(1):65–8.
25. Hassel AJ, Danner D, Freier K, Hofele C, Becker-Bikowski K, Engel M. Oral health-related quality of life and depression/anxi-ety in longterm recurrence-free patients after treatment for advanced oral squamous cell cancer. J Craniomaxillofac Surg 2012;40(4):e99–102.
26. Ingram SS, Seo PH, Sloane R, Francis T, Clipp EC, Doyle ME, et al. The association between oral health and general health and quality of life in older male cancer patients. J Am Geriatr Soc 2005;53(9):1504–9.
27. Nam YS, Jang JY. Potential factors associated with the quality of life in South Korean senior people: based on oral health. J Dent Hyg Sci 2013;13(3):281–9.
28. Shin SI, Kim YH. A metaanalysis on related variables of elder's quality of life. Korean J Couns 2013;14(6):3673–90.
29. Chung YH, Cho YH. Health behaviors, health status and quality of life among the young-old and the old-old in Korea. Korean Public Health Res 2014;40(1):55–64.
30. Kim JS. The value in quality of life and recognition and preferences for advance directives by the elderly's age. J Korean Gerontol Soc 2012;32(1):1–23.
Article information Continued

Figure 1

Regression model of variables (Standardized regression weights)

Table 1.

Oral health impact profile according to general characteristics of study participantsa

Characteristics Total (n=201) OHIP t/F Pb
Age, y
 65–74 56 (27.9) 0.73±0.97 0.19 0.845
 75–84 145 (72.1) 0.70±0.67    
 Mean±SD 76.9±4.9      
Marital status        
 Married 62 (30.8) 0.58±0.76 –1.63 0.104
 Widow Educational level 139 (69.2) 0.77±0.76    
Educational level
 No education 74 (36.8) 0.97±0.80 (A) 7.49 0.001
 Elementary school 100 (49.8) 0.56±0.74 (B)   (A≠B=C)
 Middle school 27 (13.4) 0.52±0.50 (C)    
Economic status        
 Pauper
 Low
23 (11.4)
73 (36.4)
0.97±0.08 (A)
0.82±0.69
4.08 0.018
(A≠B)
 Middle 105 (52.2) 0.57±0.70 (B)    
Living together        
 Alone 92 (45.8) 0.78±0.78 1.17 0.242
 Spouse or/and children 109 (64.2) 0.65±0.74    
Disease        
 No
 HT or DM
44 (21.9)
107 (53.2)
0.55±0.50 (A)
0.67±0.78
3.08 0.048
(B≠A)
 HT and DM 50 (24.9) 0.92±0.84 (B)    
Total   0.71±0.76    

Abbreviations: OHIP, oral health impact profile; HT, hypertension; DM, Diabetes mellitus.

a

Values are presented as mean±SD or N (%) unless otherwise indicated.

b

Calculated by t-test or ANOVA test and Duncan test.

Table 2.

Differences in ADL, depression, and quality of life according to the characteristicsa

Characteristics ADL Dep. QOL
Mean±SD t/F Pb Mean±SD t/F Pb Mean±SD t/F Pb
Age, y                  
 65–74 0.03±0.18 –0.47 0.635 6.60±4.61 0.61 0.540 2.10±0.45 –0.37 0.711
 75–84 0.05±0.28     6.24±3.42     2.13±0.40    
Marital status                  
 Married 0.00±0.00 –2.73 0.007 5.85±4.04 –1.22 0.223 2.24±0.42 2.67 0.008
 Widow 0.07±0.31     6.56±3.65     2.07±0.41    
Education level
 No education
 Elementary school
0.10±0.39 (A)
0.02±0.14
3.08 0.048
(A≠B)
7.62±3.84 (A)
6.02±3.49 (B)
10.51) <0.001
(A≠B≠C)
2.08±0.46 (A)
2.08±0.37 (B)
7.01 0.001
(A=B≠C)
 Middle school 0.00±0.00 (B)     4.03±3.41 (C)     2.40±0.36 (C)    
Economic status                  
 Pauper
 Low
 Middle
0.26±0.61 (A)
 0.05±0.22 (B)
 0.00±0.00 (C)
10.42 <0.001
 (A=B≠C)
7.82±3.39 (A)
 7.54±4.00 (B)
 5.08±3.33 (C)
11.50 <0.001
(A=B≠C)
1.94±0.53 (A)
2.06±0.42
2.20±0.37 (B)
4.87 0.009
(A≠B)
Living together                  
 Alone 0.06±0.32 0.77 0.440 7.01±3.99 2.32 0.021 2.04±0.43 2.39 0.018
 Spouse or/and children 0.03±0.10     5.77±3.51     2.19±0.39    
Disease                  
 No
 HT or DM
0.00±0.00
0.03±0.19
2.80 0.063 5.59±3.60
6.19±3.83
2.65 0.073 2.36±0.30 (A)
2.09±0.40 (B)
11.04 <0.001
(A≠B=C)
 HT and DM 0.12±0.43     7.32±3.71     1.98±0.46 (C)    
Total 0.04±0.25     6.34±3.78     2.12±0.42    

Abbreviations: ADL, activity of daily living; Dep, depression; QOL, quality of life; HT, hypertension; DM, diabetes mellitus.

a

Values are presented as mean±SD unless otherwise indicated.

b

Calculated by t-test, ANOVA, Duncan test.

Table 3.

Correlations between general characteristics, activity of daily living, oral health impact profile, depression, and quality of lifea

Variables Age Age 1 Mar. Eco. Edu. Liv. Dis. OHIP ADL Dep. QOL
Mar. 0.337 1                
  <0.001                  
Eco. –0.240 –0.169 1              
0.001 0.017                
Edu. –0.106 0.134 –0.231 0.001 0.217 0.002 1            
Liv. –0.136 –0.505 0.386 –0.037 1          
0.053 0.000 0.000 0.599            
Dis. 0.053 0.212 –0.324 –0.267 –0.217 1        
0.458 0.003 0.000 <0.001 0.002          
OHIP 0.020 0.115 –0.197 –0.222 –0.083 0.408 1      
ADL 0.778–0.004 0.104 0.128 0.005–0.282 0.002–0.157 0.242–0.055 <0.001 0.280 0.414 1    
0.956 0.070 <0.001 0.026 0.440 <0.001 <0.001      
Dep. 0.022 0.086 –0.300 –0.316 –0.162 0.343 0.115 0.520 1  
0.760 0.223 0.000 <0.001 0.021 <0.001 0.105 <0.001    
QOL 0.038 –0.186 0.216 0.192 0.167 –0.286 –0.210 –0.414 –0.639 1
0.589 0.008 0.002 0.006 0.018 <0.001 0.003 <0.001 <0.001  

Abbreviations: Mar, marital status; Eco, economic status; Edu, educational level; Liv, living together; Dis, number of disease; OHIP, oral health impact profile; ADL, activity of daily living; Dep, depression; QOL, quality of life.

a

Assessed by Pearson's correlation coefficient.

Table 4.

Parameter statistics in hypothetical modela

Variable Categories Standard estimate SE CR P
Depression ADL (γ11) –0.120 0.958 –1.842 0.045
  OHIP (γ12) 0.570 0.023 8.719 <0.001
QOL Depression (β11) –0.651 0.145 –11.995 <0.001
ADL OHIP 0.402 0.209 5.311 <0.001

Abbreviations: SE, standard error; CR, critical ratio; ADL, activity of daily living; OHIP, oral health impact profile; QOL, quality of life.

a

Calculated by multiple regression analysis using AMOS.