

| Korean J Health Promot > Volume 18(3); 2018 > Article |

|
Tel: +82-2-565-3701, Fax: +82-2-3452-2912 E-mail: hypaik@kofwst.org
Received July 26, 2018 Accepted September 19, 2018
Abstract
Background
Men and women choose different food items, and consume different amounts of food, due to biological, cultural, and social differences. However, when dietary assessment instruments are developed, gender differences in food selection and/or the portion sizes are often not considered.
Methods
Prospective cohort studies with men and women that examined the association between red or processed meat intake and colorectal cancer and published up to July 2017, were identified using PubMed. Studies were categorized as gender-specific (GS) group if the Food Frequency Questionnaire was developed using gender-specific data, and as not gender-specific (NGS) group if not gender-specific data were used.
Results
For cohort studies that reported combined intake estimates of men and women, a 100 g/day increment in red and processed meat intake was positively associated with a risk of colorectal or colon cancer in GS group (relative risk [RR], 1.23; 95% confidence interval [CI], 1.14–1.32) but not in NGS group (RR, 1.13; 95% CI, 0.90–1.35). For processed meat, the RR for 50 g/day increase was 1.28 (95% CI, 1.15–1.40) in GS group and 1.15 (95% CI, 1.03–1.27) in NGS group.
Figure 1.
Preferred Reporting Items for Systematic Reviews and Meta-Analyses (PRISMA) flowchart. Screening and selection of studies analysing the association between meat (red and processed/red/processed) intake and Colorectal cancer risk.
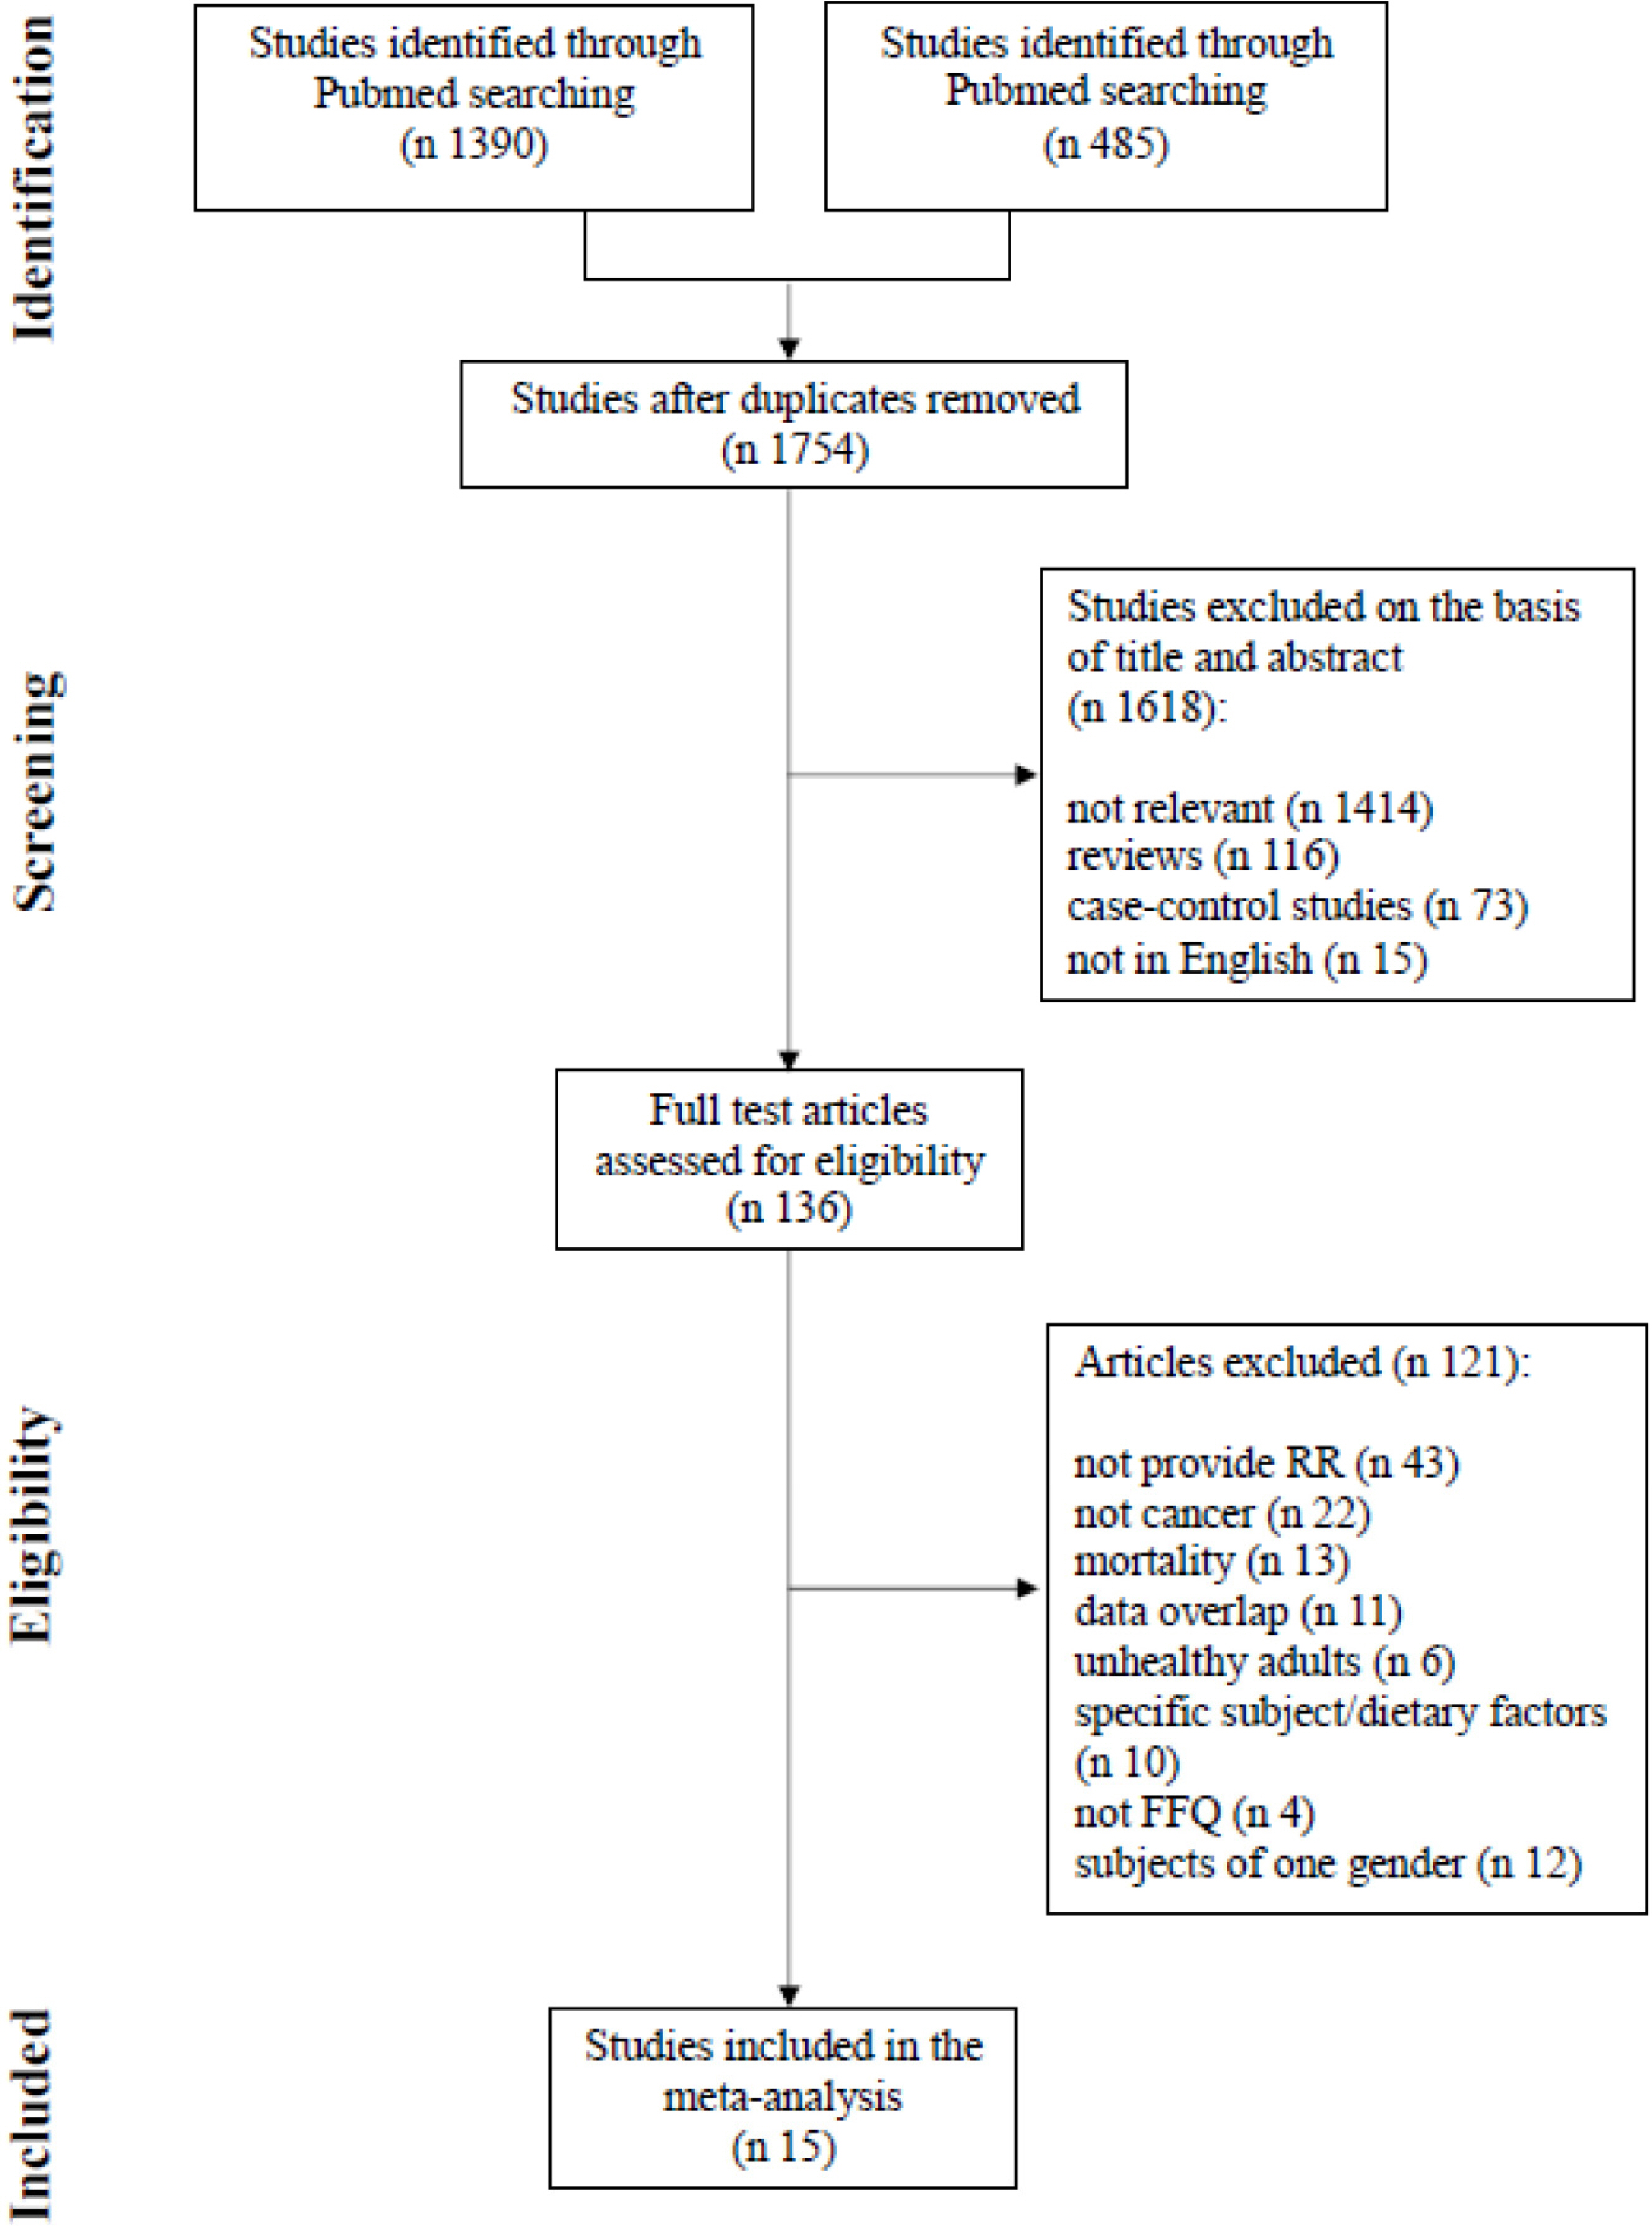
Figure 2.
Dose-response meta-analysis between red and processed meat and colorectal or colon cancer in male and female combined cohort studies (P for difference=0.340).
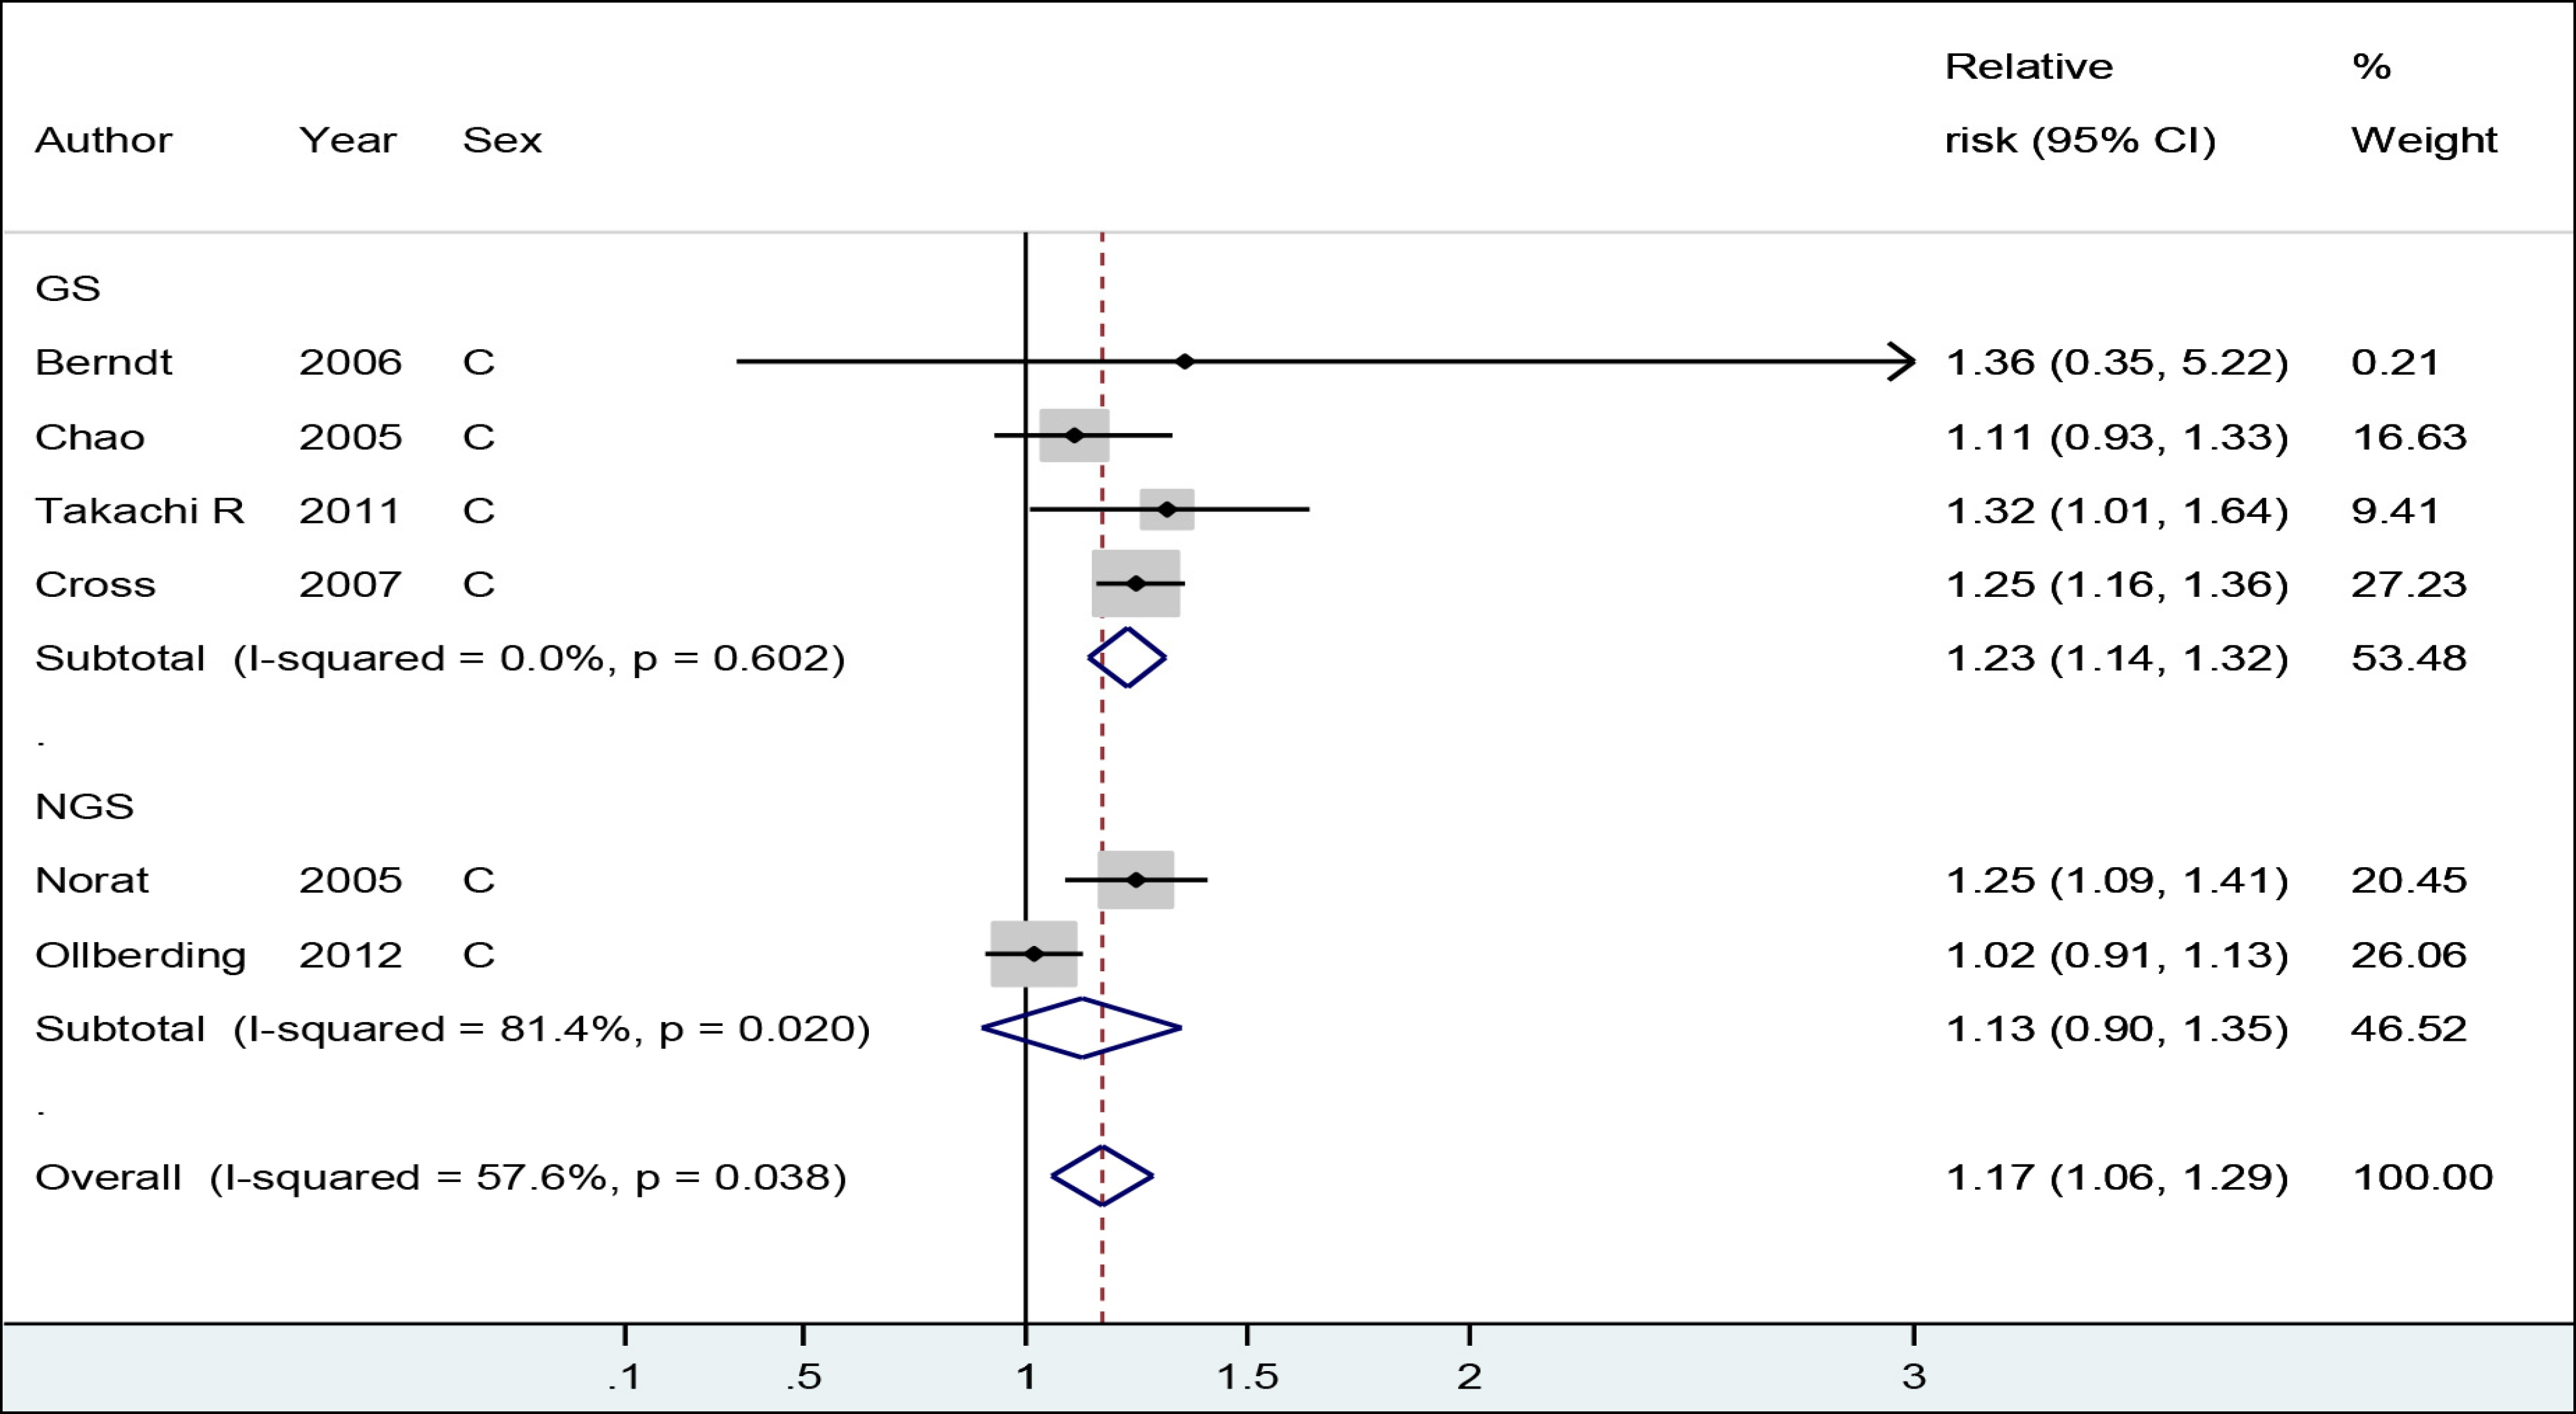
Figure 3.
Highest vs. lowest meta-analysis between red and processed meat and colorectal or colon cancer in male and female combined cohort studies (P for difference=0.022).
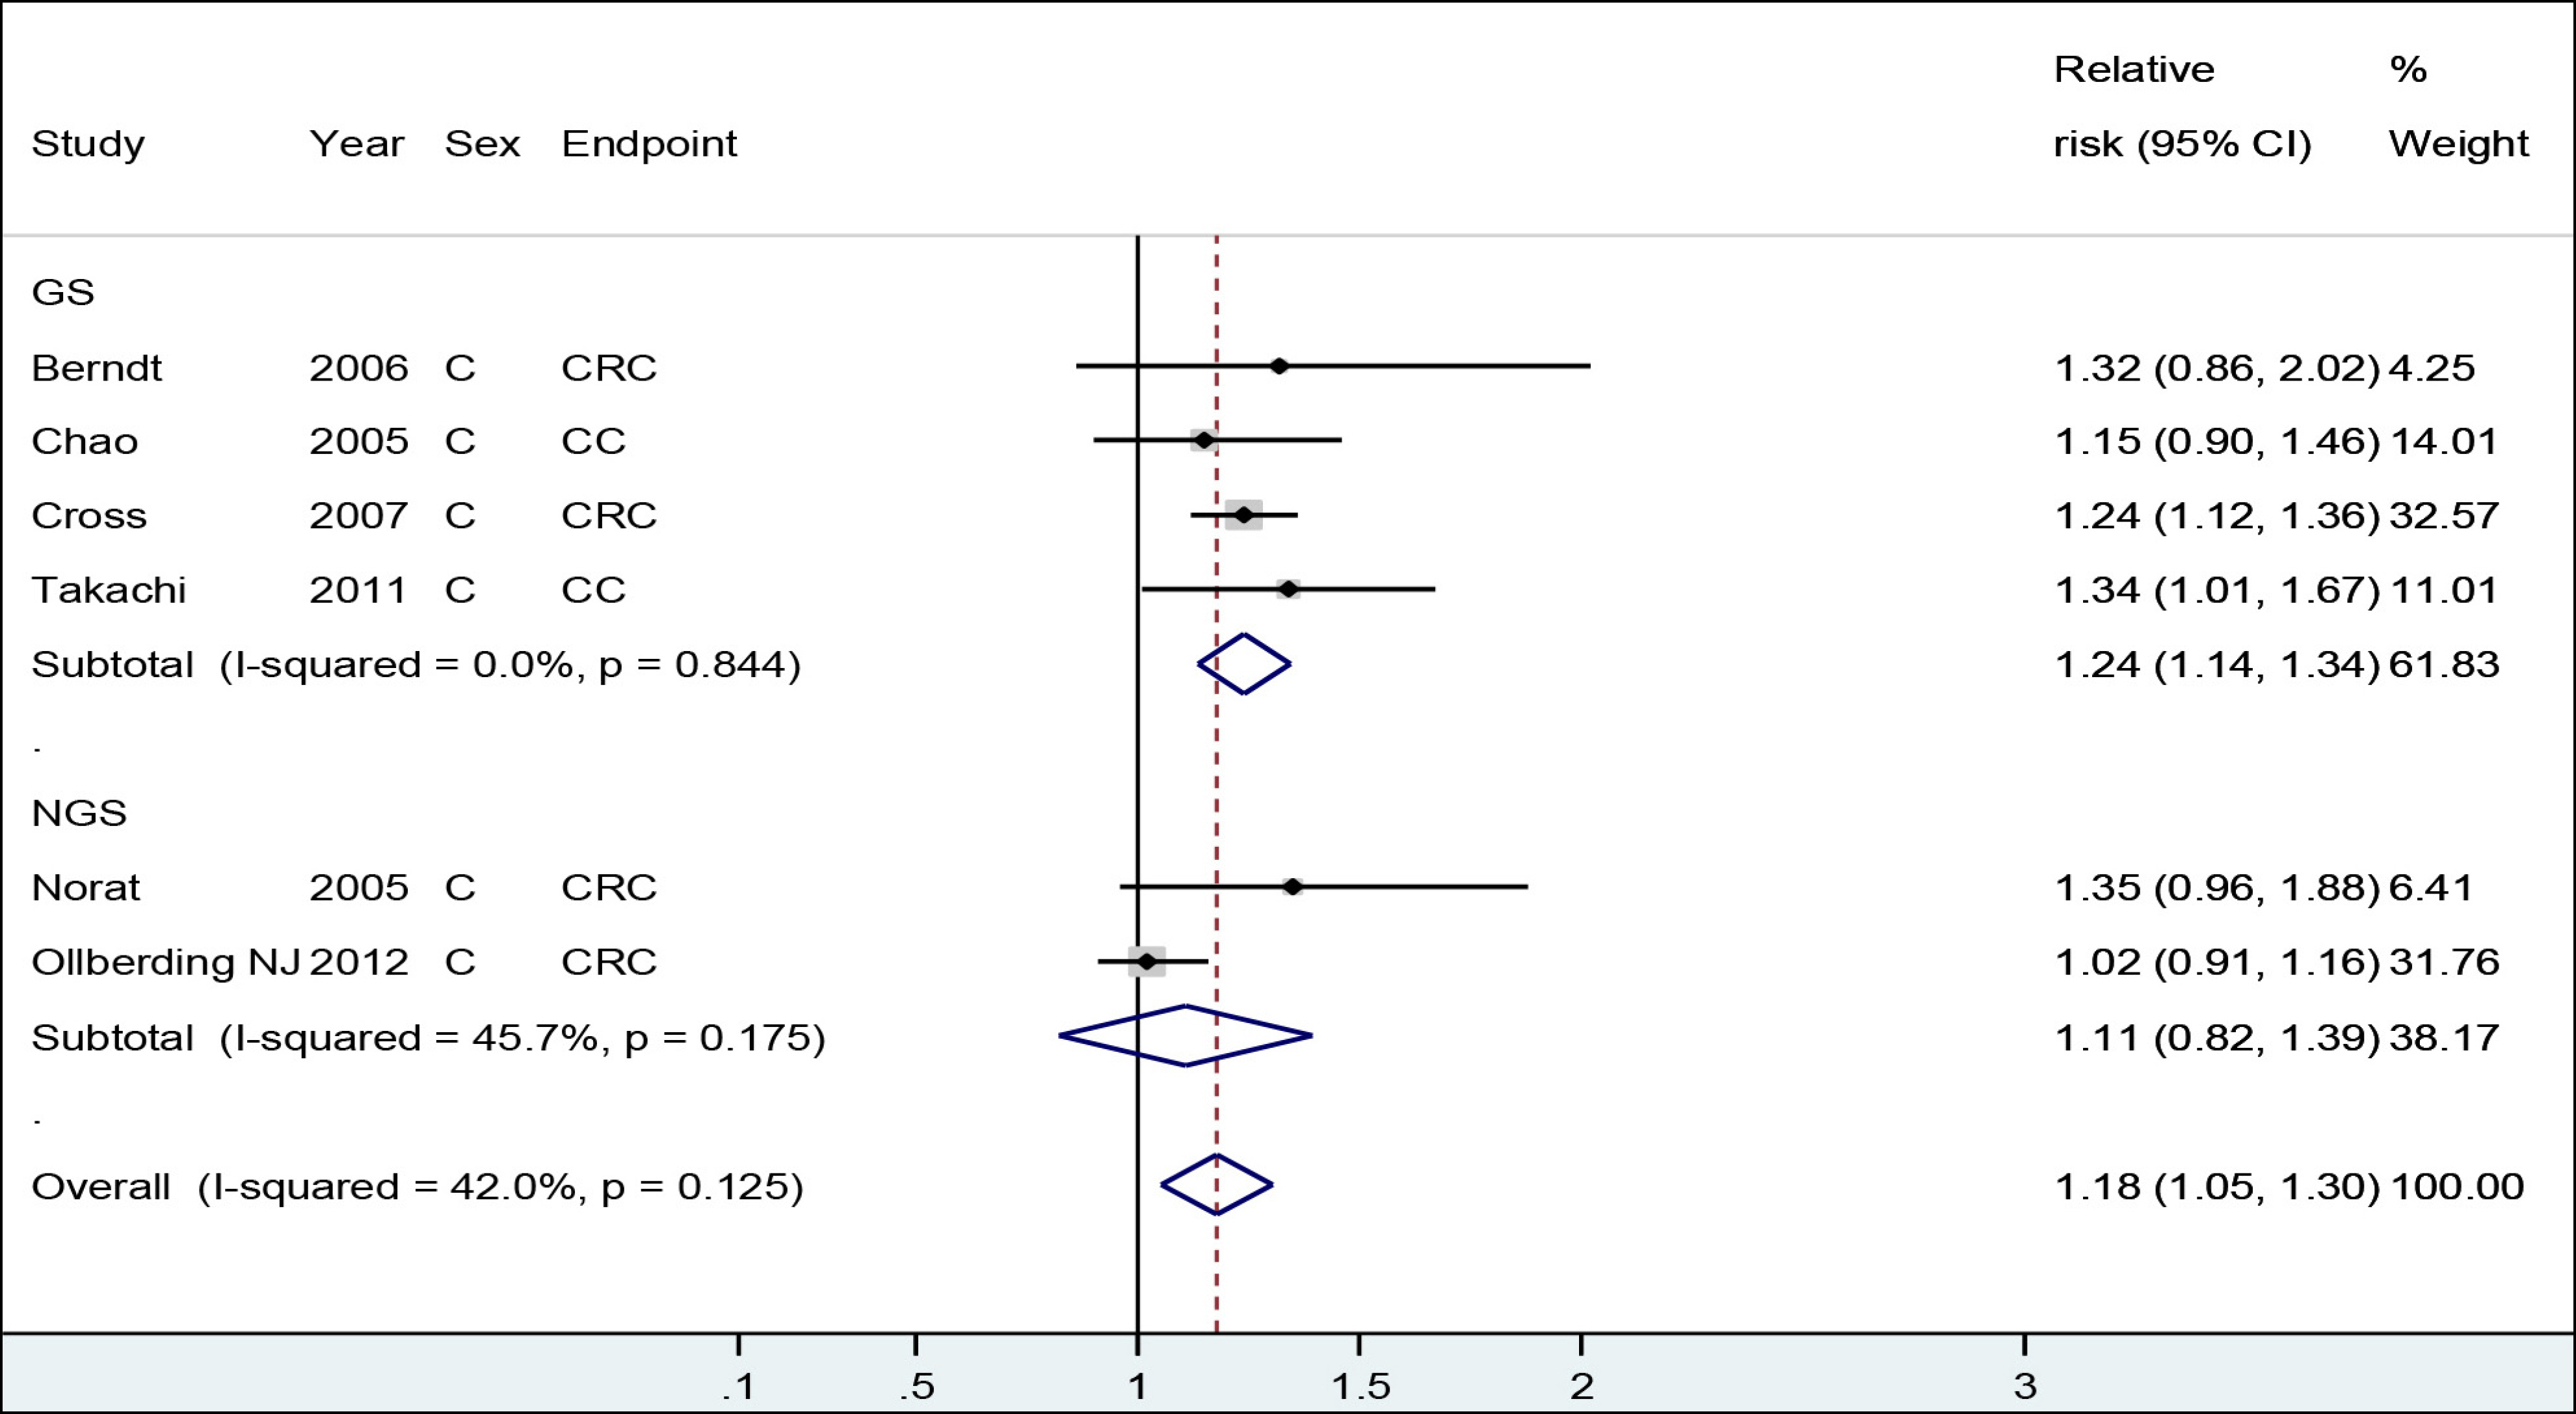
Table 1.
Characteristics of cohort studies included in the meta-analysis
Abbreviations: GS, gender-specific; CLUE II, ‘give us a clue to cancer’ study; CRC, colorectal cancer; CC, colon cancer; RC, rectal cancer; JPHC, Japan Public Health Center-based Prospective Study; MCCS, Melbourne Collaborative Cohort Study; NIH-AARP, American Association of Retired Persons' Diet and Health Study; NGS, not gender-specific; AHS, Adventist Health Study; EPIC, European Prospective Investigation into Cancer and Nutrition; FMCHES, Finnish Mobile Clinic Health Examination Survey; JACC, Japan Collaborative Cohort Study; MEC, multiethnic cohort study; SCHS, Singapore Chinese Health Study; NLCS, Netherlands Cohort Study.
Table 2.
Summary of the estimated RRs and 95% CIs for colorectal or colon cancer risk
| Dose-responsea | Highest vs. lowest | |||||||||
|---|---|---|---|---|---|---|---|---|---|---|
| N | RR | 95% CI | P for differences | Ref.b | N | RR | 95% CI | P for differences | Ref. b | |
| Red and processed meat | 0.340 | 0.022 | ||||||||
| GS | 4 | 1.23 | 1.14, 1.32 | 22,23,24,26) | 4 | 1.24 | 1.14, 1.34 | 22,23,24,26) | ||
| NGS | 2 | 1.13 | 0.90, 1.35 | 28,35) | 2 | 1.11 | 0.82, 1.39 | 28,35) | ||
| Total | 6 | 1.17 | 1.06, 1.29 | 6 | 1.18 | 1.05, 1.30 | ||||
| Red meat | NAc | NAc | ||||||||
| GS | 1 | 25) | 1 | 25) | ||||||
| NGS | 5 | 27,28,29,32,35) | 5 | 28,29,32,33,35) | ||||||
| Total | 6 | 6 | ||||||||
| Processed meat | 0.168 | 0.409 | ||||||||
| GS | 5 | 1.28 | 1.15, 1.40 | 14,23,24,25,26) | 5 | 1.18 | 1.07, 1.28 | 14,23,24,25,26) | ||
| NGS | 3 | 1.16 | 1.04, 1.28 | 28,34,35) | 7 | 1.12 | 1.03, 1.21 | 28,30,31,32, 33,34,35) | ||
| Total | 8 | 1.21 | 1.13, 1.30 | 12 | 1.15 | 1.08, 1.21 | ||||
References
1. Gender, women and Health. [Internet]. Geneva: World Health Organization; 2015. [Accessed August 31, 2017] Available from:. https://www.legal-tools.org/doc/a33dc3/pdf/.
2. Schiebinger L, Schraudner M. Interdisciplinary approaches to achieving gendered innovations in science, medicine, and engineering. Interdiscip Sci Rev 2011;36(2):154-67.

3. Bates CJ, Prentice A, Finch S. Gender differences in food and nutrient intakes and status indices from the National Diet and Nutrition Survey of people aged 65 years and over. Eur J Clin Nutr 1999;53(9):694-9.


4. Wardle J, Haase AM, Steptoe A, Nillapun M, Jonwutiwes K, Bellisle F. Gender differences in food choice: the contribution of health beliefs and dieting. Ann Behav Med 2004;27(2):107-16.
5. Turrell G. Determinants of gender differences in dietary behavior. Nutr Res 1997;17(7):1105-20.
6. Brug J, Tak NI, te Velde SJ, Bere E, de Bourdeaudhuij I. Taste preferences, liking and other factors related to fruit and vegetable intakes among schoolchildren: results from observational studies. Br J Nutr 2008;99(Suppl 1):S7-14.
7. Blaak E. Gender differences in fat metabolism. Curr Opin Clin Nutr Metab Care 2001;4(6):499-502.
8. Tarnopolsky MA. Females and males: should nutritional recommendations be gender specific? Schweiz Z Med Traumatol 2003;51(1):39-46.
9. Wu BN, O'Sullivan AJ. Sex differences in energy metabolism need to be considered with lifestyle modifications in humans. J Nutr Metab 2011;2011:391809.

10. Lee H, Kang M, Song WO, Shim JE, Paik HY. Gender analysis in the development and validation of FFQ: a systematic review. Br J Nutr 2016;115(4):666-71.
11. Willett W. Nutritional epidemiology. 3rd ed.. New York: Oxford University Press; 2012. p. 70-141.
12. Bouvard V, Loomis D, Guyton KZ, Grosse Y, Ghissassi FE, Benbrahim-Tallaa L, et al. Carcinogenicity of consumption of red and processed meat. Lancet Oncol 2015;16(16):1599-600.
13. Stroup DF, Berlin JA, Morton SC, Olkin I, Williamson GD, Rennie D, et al. Meta-analysis of observational studies in epidemiology: a proposal for reporting. Meta-analysis Of Observational Studies in Epidemiology (MOOSE) group. JAMA 2000;283(15):2008-12.
14. Sato Y, Nakaya N, Kuriyama S, Nishino Y, Tsubono Y, Tsuji I. Meat consumption and risk of colorectal cancer in Japan: the Miyagi cohort study. Eur J Cancer Prev 2006;15(3):211-8.
15. DerSimonian R, Laird N. Meta-analysis in clinical trials. Control Clin Trials 1986;7(3):177-88.
16. Orsini N, Bellocco R, Greenland S. Generalized least squares for trend estimation of summarized doseresponse data. Stata J 2006;6(1):40-57.
17. Chan DS, Lau R, Aune D, Vieira R, Greenwood DC, Kampman E, et al. Red and processed meat and colorectal cancer incidence: metaanalysis of prospective studies. PLoS One 2011;6(6):e20456.
18. Kang M, Park S, Boushey CJ, Wilkens LR, et al. Portion sizes from 24-hour dietary recalls differed by sex among those who selected the same portion size category on a food frequency questionnaire. J Acad of Nutr Diet 2018;118(9):1711-8.
19. Marks GC, Hughes MC, van der Pols JC. The effect of personal characteristics on the validity of nutrient intake estimates using a food-frequency questionnaire. Public Health Nutr 2006;9(3):394-402.
20. Marks GC, Hughes MC, van der Pols JC. Relative validity of food intake estimates using a food frequency questionnaire is associated with sex, age, and other personal characteristics. J Nutr 2006;136(2):459-65.
21. Cade JE, Burley VJ, Warm DL, Thompson RL, Margetts BM. Food-frequency questionnaires: a review of their design, validation and utilisation. Nutr Res Rev 2004;17(1):5-22.
22. Berndt SI, Platz EA, Fallin MD, Thuita LW, Hoffman SC, Helzlsouer KJ. Genetic variation in the nucleotide excision repair pathway and colorectal cancer risk. Cancer Epidemiol Biomarkers Prev 2006;15(11):2263-9.
23. Chao A, Thun MJ, Connell CJ, McCullough ML, Jacobs EJ, Flanders WD, et al. Meat consumption and risk of colorectal cancer. JAMA 2005;293(2):172-82.
24. Takachi R, Tsubono Y, Baba K, Inoue M, Sasazuki S, Iwasaki M, et al. Red meat intake may increase the risk of colon cancer in Japanese, a population with relatively low red meat consumption. Asia Pac J Clin Nutr 2011;20(4):603-12.
25. English DR, MacInnis RJ, Hodge AM, Hopper JL, Haydon AM, Giles GG. Red meat, chicken, and fish consumption and risk of colorectal cancer. Cancer Epidemiol Biomarkers Prev 2004;13(9):1509-14.
26. Cross AJ, Leitzmann MF, Gail MH, Hollenbeck AR, Schatzkin A, Sinha R. A prospective study of red and processed meat intake in relation to cancer risk. PLoS Med 2007;4(12):e325.
27. Singh PN, Fraser GE. Dietary risk factors for colon cancer in a low-risk population. Am J Epidemiol 1998;148(8):761-74.
28. Norat T, Bingham S, Ferrari P, Slimani N, Jenab M, Mazuir M, et al. Meat, fish, and colorectal cancer risk: the European prospective investigation into cancer and nutrition. J Natl Cancer Inst 2005;97(12):906-16.
29. Järvinen R, Knekt P, Hakulinen T, Rissanen H, Heliövaara M. Dietary fat, cholesterol and colorectal cancer in a prospective study. Br J Cancer 2001;85(3):357-61.
30. Knekt P, Järvinen R, Dich J, Hakulinen T. Risk of colorectal and other gastrointestinal cancers after exposure to nitrate, nitrite and N-nitroso compounds: a follow-up study. Int J Cancer 1999;80(6):852-6.
31. Iso H, Kubota Y. Japan Collaborative Cohort Study for Evaluation of Cancer. Nutrition and disease in the Japan collaborative cohort study for evaluation of cancer (JACC). Asian Pac J Cancer Prev 2007;8(Suppl):35-80.
32. Ollberding NJ, Wilkens LR, Henderson BE, Kolonel LN, Le Marchand L. Meat consumption, heterocyclic amines and colorectal cancer risk: the Multiethnic Cohort Study. Int J Cancer 2012;131(7):E1125-33.
33. Chen J, Stampfer MJ, Hough HL, Garcia-Closas M, Willett WC, Hennekens CH, et al. A prospective study of N-acetyltransferase genotype, red meat intake, and risk of colorectal cancer. Cancer Res 1998;58(15):3307-11.
34. Balder HF, Vogel J, Jansen MC, Weijenberg MP, van den Brandt PA, Westenbrink S, et al. Heme and chlorophyll intake and risk of colorectal cancer in the Netherlands cohort study. Cancer Epidemiol Biomarkers Prev 2006;15(4):717-25.
35. Wada K, Oba S, Tsuji M, Tamura T, Konishi K, Goto Y, et al. Meat consumption and colorectal cancer risk in Japan: the Takayama study. Cancer Sci 2017;108(5):1065-70.
 PDF Links
 PubReader
 ePub Link
 Full text via DOI
 Download Citation
 Print
Print


-
METRICS

-
- 0 Crossref
- 0 Scopus
- 1,801 View
- 7 Download
- Related articles
- Editorial Office
-
Department of Family Medicine, Asan Medical Center, 88, Olympic-ro 43-gil, Songpa-gu, Seoul 05505, Korea
Tel: +82-2-3010-3820 Fax: +82-2-3010-3815 E-mail: kshpdp@amc.seoul.kr
Copyright © 2026 by Korean Society For Health Promotion And Disease Prevention.
