

| Korean J Health Promot > Volume 17(4); 2017 > Article |

|
Tel: +82-2-709-9158, Fax: +82-2-795-3687, dryoo@schmc.ac.kr
ABSTRACT
Background
Methods
Results
REFERENCES
Figure 1
System accuracy plot and consensus error grid analysis of G300. The letter A means ‘error grid zone A’ and the letter B means ‘error grid zone B’. Error grid analysis showed that all values (100%) are within zone A.
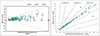
Figure 2
Interference of hematocrit. Interval 1 glucose concentration is 30–50 mg/dL, interval 2 is 96–144 mg/dL and interval 3 is 280–420 mg/dL. Difference from hematocrit 40% was within ±10 mg/dL in interval 1 and difference from hematocrit 40% was within ±10% in interval 2 and 3.
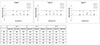
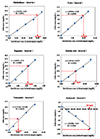
Figure 4
System accuracy plot, consensus error grid analysis (CEG) and correlation between user and technician. The letter A means ‘error grid zone A’ and the letter B means ‘error grid zone B’. Error grid analysis showed that all values (100%) are within zone A.
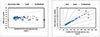
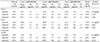
Table 1
Within-run precision of G300
Abbreviations: YSI, yellow springs instruments; SD, standard deviation; CV, coefficient of variation.
Acceptance criteria: <100 mg/dL: SD less than 5 mg/dL, ≥100 mg/dL: CV less than 5%. The numbers in the farthest left of the table represent 5 consecutive intervals of concentration levels (30–50 mg/dL, 51–110 mg/dL, 111–150 mg/dL, 151–250 mg/dL, 251–400 mg/dL) to which blood glucose concentrations sampled from patients belong to.
Table 2
Day to day precision of G300
Abbreviations: Conc., concentration; SD, standard deviation; CV, coefficient of variation.
Acceptance criteria: <100 mg/dL: SD less than 5 mg/dL, ≥100 mg/dL: CV less than 5%. The intervals 1 to 3 represent 3 intervals of blood glucose concentrations (30–50 mg/dL, 96–144 mg/dL, 280–420 mg/dL) and the numbers next to them are blood glucose concentrations of the samples of controls provided by the manufacturers accordingly to each intervals.
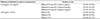
Table 4
Interference test of 24 possible interfering substances
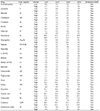
Abbreviations: Conc., concentration; EDTA, ethylenediaminetetraacetic acid; L-DOPA, L-3, 4-dihydroxyphenylalanine; DOPA, dihydroxyphenylalanine.
Glucose low: 50–100 mg/dL, high: 250–350 mg/dL.
aEach result from Lot1, Lot2, Lot3, and AVG means average of difference from control sample 10 times repeated measurement. Acceptance criteria is that difference from control sample was within ±10 mg/dL in low glucose interval (<100 mg/dL) and difference from control sample was within ±10% in high glucose interval (≥100 mg/dL).
 PDF Links
 PubReader
 ePub Link
 Full text via DOI
 Download Citation
 Print
Print


-
METRICS

-
- 0 Crossref
- 0 Scopus
- 2,012 View
- 7 Download
- Related articles
- Editorial Office
-
Department of Family Medicine, Asan Medical Center, 88, Olympic-ro 43-gil, Songpa-gu, Seoul 05505, Korea
Tel: +82-2-3010-3820 Fax: +82-2-3010-3815 E-mail: kshpdp@amc.seoul.kr
Copyright © 2026 by Korean Society For Health Promotion And Disease Prevention.
